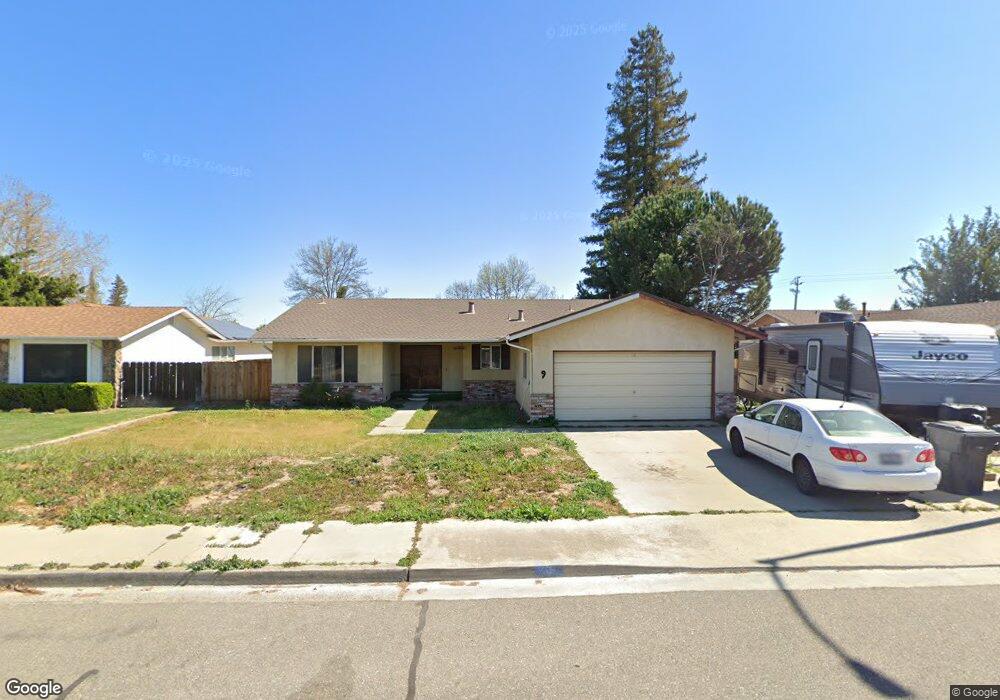
9 Willow Glen Ave Oakdale, CA 95361
Estimated Value: $437,562 - $465,000
3
Beds
2
Baths
1,447
Sq Ft
$308/Sq Ft
Est. Value
About This Home
This home is located at 9 Willow Glen Ave, Oakdale, CA 95361 and is currently estimated at $445,391, approximately $307 per square foot. 9 Willow Glen Ave is a home located in Stanislaus County with nearby schools including Fair Oaks Elementary School, Oakdale Junior High School, and East Stanislaus High School.
Ownership History
Date
Name
Owned For
Owner Type
Purchase Details
Closed on
May 17, 2022
Sold by
Harper Mark W and Harper Donna J
Bought by
Harper Mark W and Harper Donna J
Current Estimated Value
Home Financials for this Owner
Home Financials are based on the most recent Mortgage that was taken out on this home.
Original Mortgage
$290,000
Outstanding Balance
$275,617
Interest Rate
5.3%
Mortgage Type
New Conventional
Estimated Equity
$169,775
Purchase Details
Closed on
Oct 17, 1995
Sold by
Smith Elmer Alton and Smith Donna Lee
Bought by
Harper Mark W and Harper Donna J
Home Financials for this Owner
Home Financials are based on the most recent Mortgage that was taken out on this home.
Original Mortgage
$88,000
Interest Rate
7.62%
Purchase Details
Closed on
Dec 3, 1993
Sold by
Smith Elmer Edward
Bought by
Smith Elmer Alton and Smith Donna Lee
Create a Home Valuation Report for This Property
The Home Valuation Report is an in-depth analysis detailing your home's value as well as a comparison with similar homes in the area
Home Values in the Area
Average Home Value in this Area
Purchase History
| Date | Buyer | Sale Price | Title Company |
|---|---|---|---|
| Harper Mark W | -- | Stewart Title | |
| Harper Mark W | $110,000 | Fidelity National Title Ins | |
| Smith Elmer Alton | -- | -- |
Source: Public Records
Mortgage History
| Date | Status | Borrower | Loan Amount |
|---|---|---|---|
| Open | Harper Mark W | $290,000 | |
| Previous Owner | Harper Mark W | $88,000 |
Source: Public Records
Tax History Compared to Growth
Tax History
| Year | Tax Paid | Tax Assessment Tax Assessment Total Assessment is a certain percentage of the fair market value that is determined by local assessors to be the total taxable value of land and additions on the property. | Land | Improvement |
|---|---|---|---|---|
| 2025 | $1,961 | $182,717 | $66,440 | $116,277 |
| 2024 | $1,858 | $179,136 | $65,138 | $113,998 |
| 2023 | $1,818 | $175,624 | $63,861 | $111,763 |
| 2022 | $1,785 | $172,181 | $62,609 | $109,572 |
| 2021 | $1,754 | $168,806 | $61,382 | $107,424 |
| 2020 | $1,734 | $167,076 | $60,753 | $106,323 |
| 2019 | $1,706 | $163,801 | $59,562 | $104,239 |
| 2018 | $1,681 | $160,591 | $58,395 | $102,196 |
| 2017 | $1,651 | $157,443 | $57,250 | $100,193 |
| 2016 | $1,620 | $154,357 | $56,128 | $98,229 |
| 2015 | $1,599 | $152,039 | $55,285 | $96,754 |
| 2014 | $1,583 | $149,062 | $54,203 | $94,859 |
Source: Public Records
Map
Nearby Homes
- 1948 Sugar Pine Dr
- 1972 Sugar Pine Dr
- 15 Willowood Dr
- 1625 Valmor Ct
- 491 Nicholas Ct
- 1421 Pontiac St
- 2306 W F St
- 1601 W J St
- 2295 Pontiac St
- 2337 Rainwood Ln
- 1863 Vintage Cir
- 2030 Baluchi Way
- 596 Hudson Ave
- 736 Jonabel Way
- 1766 Churchill Downs Cir
- 549 Fresian Dr
- 2201 Mustang Dr
- 2272 Tori Way
- 1743 Churchill Downs Cir
- 1759 Churchill Downs Cir
- 5 Willow Glen Ave
- 17 Willow Glen Ave
- 12 Willow Glen Ave
- 1800 W F St
- 14 Willow Glen Ave
- 1750 W F St
- 8 Willow Glen Ave
- 16 Willow Glen Ave
- 6 Willow Glen Ave
- 21 Willow Glen Ave
- 20 Willow Glen Ave
- 37 Black Pine Way
- 39 Black Pine Way
- 25 Willow Glen Ave
- 35 Black Pine Way
- 33 Black Pine Way
- 41 Black Pine Way
- 31 Black Pine Way
- 43 Black Pine Way
- 26 Willow Glen Ave