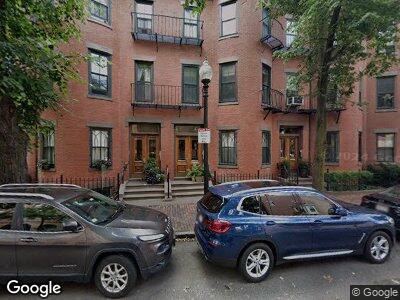
90 Chandler St Unit 3 Boston, MA 02116
South End NeighborhoodEstimated Value: $1,310,000 - $1,543,000
2
Beds
2
Baths
1,200
Sq Ft
$1,206/Sq Ft
Est. Value
About This Home
This home is located at 90 Chandler St Unit 3, Boston, MA 02116 and is currently estimated at $1,446,706, approximately $1,205 per square foot. 90 Chandler St Unit 3 is a home located in Suffolk County with nearby schools including Kingsley Montessori School and Cathedral High School.
Ownership History
Date
Name
Owned For
Owner Type
Purchase Details
Closed on
Apr 12, 2022
Sold by
Gross Kelly F
Bought by
Gross Kelly F and Gross Douglas Alexander
Current Estimated Value
Home Financials for this Owner
Home Financials are based on the most recent Mortgage that was taken out on this home.
Original Mortgage
$930,000
Outstanding Balance
$878,362
Interest Rate
3.76%
Mortgage Type
Stand Alone Refi Refinance Of Original Loan
Estimated Equity
$571,888
Purchase Details
Closed on
Jan 13, 2022
Sold by
Churchill Bruce H and White Scott
Bought by
Gross Kelly F
Purchase Details
Closed on
Jun 15, 2007
Sold by
Everly John D and Everly Cecilie T
Bought by
Churchill Bruce H and White Scott
Home Financials for this Owner
Home Financials are based on the most recent Mortgage that was taken out on this home.
Original Mortgage
$625,000
Interest Rate
6.19%
Mortgage Type
Purchase Money Mortgage
Purchase Details
Closed on
Mar 31, 1993
Sold by
Mcnally Michael J
Bought by
Pardo Francisco
Create a Home Valuation Report for This Property
The Home Valuation Report is an in-depth analysis detailing your home's value as well as a comparison with similar homes in the area
Home Values in the Area
Average Home Value in this Area
Purchase History
| Date | Buyer | Sale Price | Title Company |
|---|---|---|---|
| Gross Kelly F | -- | None Available | |
| Gross Kelly F | $1,480,000 | None Available | |
| Gross Kelly F | $1,480,000 | None Available | |
| Churchill Bruce H | $825,000 | -- | |
| Churchill Bruce H | $825,000 | -- | |
| Churchill Bruce H | $825,000 | -- | |
| Pardo Francisco | $206,250 | -- | |
| Pardo Francisco | $206,250 | -- |
Source: Public Records
Mortgage History
| Date | Status | Borrower | Loan Amount |
|---|---|---|---|
| Open | Gross Kelly F | $930,000 | |
| Previous Owner | Churchill Bruce H | $485,000 | |
| Previous Owner | Churchill Bruce H | $465,750 | |
| Previous Owner | Pardo Francisco | $523,750 | |
| Previous Owner | Pardo Francisco | $85,000 | |
| Previous Owner | Churchill Bruce H | $46,300 | |
| Previous Owner | Churchill Bruce H | $625,000 |
Source: Public Records
Tax History Compared to Growth
Tax History
| Year | Tax Paid | Tax Assessment Tax Assessment Total Assessment is a certain percentage of the fair market value that is determined by local assessors to be the total taxable value of land and additions on the property. | Land | Improvement |
|---|---|---|---|---|
| 2025 | $14,528 | $1,254,600 | $0 | $1,254,600 |
| 2024 | $13,152 | $1,206,600 | $0 | $1,206,600 |
| 2023 | $11,866 | $1,104,800 | $0 | $1,104,800 |
| 2022 | $11,448 | $1,052,200 | $0 | $1,052,200 |
| 2021 | $11,227 | $1,052,200 | $0 | $1,052,200 |
| 2020 | $10,771 | $1,020,000 | $0 | $1,020,000 |
| 2019 | $10,439 | $990,400 | $0 | $990,400 |
| 2018 | $9,793 | $934,400 | $0 | $934,400 |
| 2017 | $9,338 | $881,800 | $0 | $881,800 |
| 2016 | $9,327 | $847,900 | $0 | $847,900 |
| 2015 | $9,212 | $760,700 | $0 | $760,700 |
| 2014 | $8,718 | $693,000 | $0 | $693,000 |
Source: Public Records
Map
Nearby Homes
- 75 Chandler St
- 70 Clarendon St Unit 1
- 11 Cazenove St
- 114 Chandler St Unit G1
- 58 Chandler St
- 36 Appleton St Unit 4
- 36 Appleton St Unit 1
- 3 Lawrence St
- 1 Saint Charles St Unit 3
- 95 Appleton St Unit 1
- 95 Appleton St Unit 2
- 24 Appleton St
- 306 Columbus Ave Unit 2
- 285 Columbus Ave Unit 606
- 285 Columbus Ave Unit 407
- 285 Columbus Ave Unit 803
- 28 Clarendon St
- 96 Appleton St Unit 1
- 78 Berkeley St Unit 7
- 11 Appleton St Unit 1
- 90 Chandler St Unit 3
- 90 Chandler St Unit 2
- 90 Chandler St Unit 1
- 92 Chandler St Unit 6
- 92 Chandler St Unit 5
- 92 Chandler St Unit 4
- 92 Chandler St Unit 3
- 92 Chandler St
- 92 Chandler St Unit 2
- 92 Chandler St Unit 1
- 92 Chandler St Unit 3, 92
- 94 Chandler St Unit 9
- 94 Chandler St Unit 8
- 94 Chandler St Unit 7
- 96 Chandler St Unit 3
- 96 Chandler St Unit 2
- 96 Chandler St Unit 1
- 96 Chandler St Unit 3,96
- 88 Chandler St Unit 3
- 88 Chandler St Unit 2