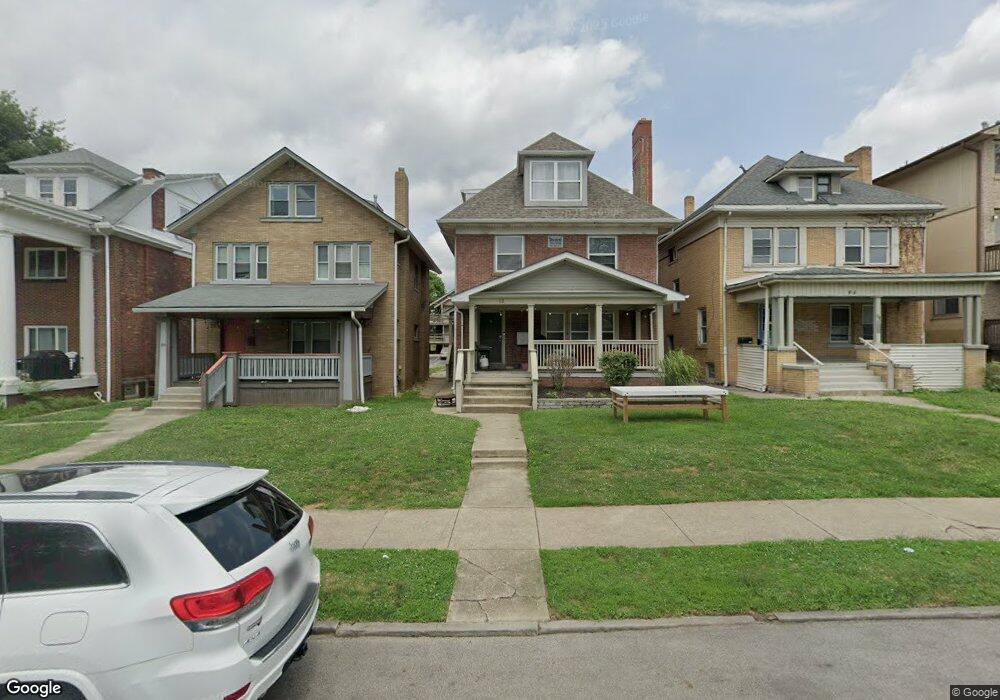
90 E 13th Ave Columbus, OH 43201
Estimated Value: $1,088,798
8
Beds
4
Baths
6,470
Sq Ft
$168/Sq Ft
Est. Value
About This Home
This home is located at 90 E 13th Ave, Columbus, OH 43201 and is currently estimated at $1,088,798, approximately $168 per square foot. 90 E 13th Ave is a home located in Franklin County with nearby schools including Weinland Park Elementary School, Dominion Middle School, and Whetstone High School.
Ownership History
Date
Name
Owned For
Owner Type
Purchase Details
Closed on
Oct 6, 2016
Sold by
Dunkel Richard L and Dunkel Joanne L
Bought by
Richard 90 Llc
Current Estimated Value
Purchase Details
Closed on
Feb 1, 1999
Sold by
Ghg Group
Bought by
Dunkel Richard L and Dunkel Joanne L
Purchase Details
Closed on
Oct 22, 1997
Sold by
Comet Group Ltd
Bought by
Ghg Group
Home Financials for this Owner
Home Financials are based on the most recent Mortgage that was taken out on this home.
Original Mortgage
$262,500
Interest Rate
7.65%
Mortgage Type
Commercial
Purchase Details
Closed on
Jun 28, 1995
Sold by
National City Bank
Bought by
Comet Group Inc
Home Financials for this Owner
Home Financials are based on the most recent Mortgage that was taken out on this home.
Original Mortgage
$380,000
Interest Rate
7.88%
Mortgage Type
Commercial
Purchase Details
Closed on
Mar 30, 1995
Sold by
Campus Properties Xiii L
Bought by
National City Bank
Create a Home Valuation Report for This Property
The Home Valuation Report is an in-depth analysis detailing your home's value as well as a comparison with similar homes in the area
Purchase History
| Date | Buyer | Sale Price | Title Company |
|---|---|---|---|
| Richard 90 Llc | -- | None Available | |
| Dunkel Richard L | $375,000 | Cardinal Title | |
| Ghg Group | $90,000 | Hummel Title Agency Inc | |
| Comet Group Inc | $425,000 | -- | |
| National City Bank | $434,000 | -- |
Source: Public Records
Mortgage History
| Date | Status | Borrower | Loan Amount |
|---|---|---|---|
| Previous Owner | Ghg Group | $262,500 | |
| Previous Owner | Comet Group Inc | $380,000 |
Source: Public Records
Tax History
| Year | Tax Paid | Tax Assessment Tax Assessment Total Assessment is a certain percentage of the fair market value that is determined by local assessors to be the total taxable value of land and additions on the property. | Land | Improvement |
|---|---|---|---|---|
| 2025 | $9,488 | $207,030 | $24,750 | $182,280 |
| 2024 | $9,488 | $207,030 | $24,750 | $182,280 |
| 2023 | $9,369 | $207,030 | $24,750 | $182,280 |
| 2022 | $12,193 | $229,430 | $22,790 | $206,640 |
| 2021 | $12,214 | $229,430 | $22,790 | $206,640 |
| 2020 | $12,233 | $229,430 | $22,790 | $206,640 |
| 2019 | $12,405 | $199,500 | $19,810 | $179,690 |
| 2018 | $6,192 | $199,500 | $19,810 | $179,690 |
| 2017 | $12,403 | $199,500 | $19,810 | $179,690 |
| 2016 | $12,602 | $185,500 | $19,810 | $165,690 |
| 2015 | $5,737 | $185,500 | $19,810 | $165,690 |
| 2014 | $11,502 | $185,500 | $19,810 | $165,690 |
| 2013 | $5,673 | $185,500 | $19,810 | $165,690 |
Source: Public Records
Map
Nearby Homes
- 76 Chittenden Ave
- 1777 Summit St
- 288 E 14th Ave
- 335 E 18th Ave Unit 333
- 384 E 17th Ave
- 408 E 14th Ave
- 445 E 16th Ave
- 1440-1442 Hamlet St
- 27 W 8th Ave
- 1988 1990 N 4th St
- 1411 N 5th St
- 1342 Hamlet St Unit 344
- 93 King Ave Unit 95
- 1520 Neil Ave
- 2082 N 4th St
- 9 E Norwich Ave Unit 15
- 1376 N 6th St
- 1336 N 5th St Unit 338
- 1276 N High St Unit 402
- 63 Smith Place
Your Personal Tour Guide
Ask me questions while you tour the home.