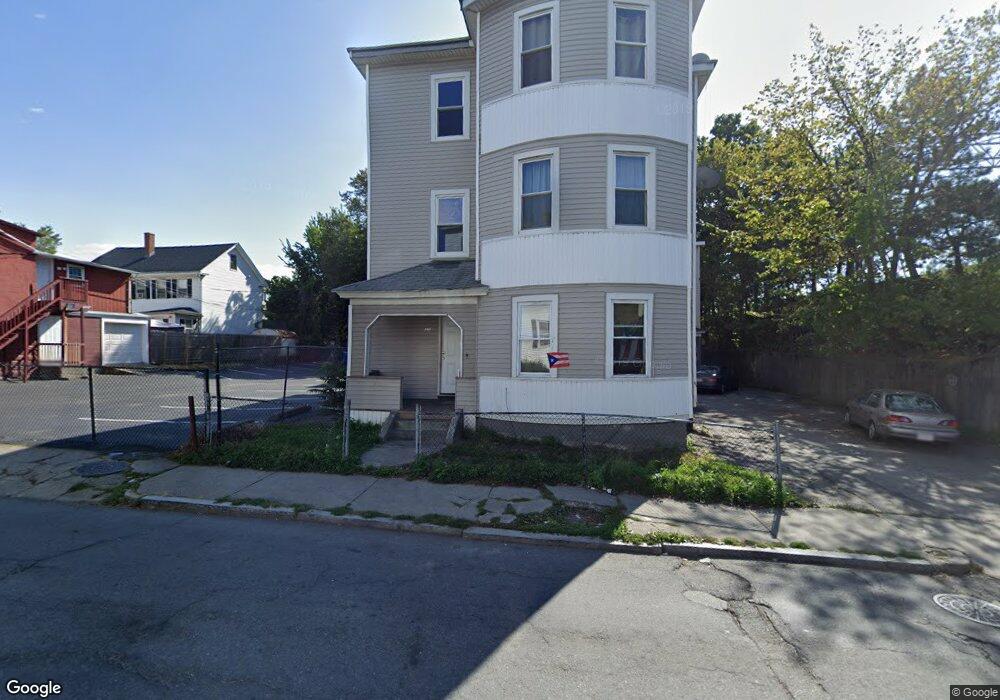
90 Endicott St Worcester, MA 01610
Vernon Hill NeighborhoodEstimated Value: $372,487 - $747,000
9
Beds
3
Baths
3,324
Sq Ft
$191/Sq Ft
Est. Value
About This Home
This home is located at 90 Endicott St, Worcester, MA 01610 and is currently estimated at $636,372, approximately $191 per square foot. 90 Endicott St is a home located in Worcester County with nearby schools including Jacob Hiatt Magnet School, Quinsigamond School, and Chandler Magnet.
Ownership History
Date
Name
Owned For
Owner Type
Purchase Details
Closed on
Jun 26, 2017
Sold by
Hatarbut Investment Ll
Bought by
Neupane Pushkar
Current Estimated Value
Home Financials for this Owner
Home Financials are based on the most recent Mortgage that was taken out on this home.
Original Mortgage
$150,000
Outstanding Balance
$124,572
Interest Rate
4.05%
Mortgage Type
New Conventional
Estimated Equity
$511,800
Purchase Details
Closed on
Mar 23, 2010
Sold by
Shea John F and Amtrust Bk
Bought by
Sherban Tatyana
Purchase Details
Closed on
Jul 5, 2005
Sold by
Sheerin Michael W
Bought by
Shea John F and Orciani Nathaniel J
Home Financials for this Owner
Home Financials are based on the most recent Mortgage that was taken out on this home.
Original Mortgage
$268,000
Interest Rate
5.73%
Mortgage Type
Purchase Money Mortgage
Create a Home Valuation Report for This Property
The Home Valuation Report is an in-depth analysis detailing your home's value as well as a comparison with similar homes in the area
Home Values in the Area
Average Home Value in this Area
Purchase History
| Date | Buyer | Sale Price | Title Company |
|---|---|---|---|
| Neupane Pushkar | $200,000 | -- | |
| Sherban Tatyana | $86,000 | -- | |
| Hatarbut Invest Llc | $100,000 | -- | |
| Sherban Tatyana | $86,000 | -- | |
| Shea John F | $335,000 | -- | |
| Shea John F | $335,000 | -- |
Source: Public Records
Mortgage History
| Date | Status | Borrower | Loan Amount |
|---|---|---|---|
| Open | Neupane Pushkar | $150,000 | |
| Closed | Shea John F | $150,000 | |
| Previous Owner | Shea John F | $725,000 | |
| Previous Owner | Shea John F | $268,000 |
Source: Public Records
Tax History
| Year | Tax Paid | Tax Assessment Tax Assessment Total Assessment is a certain percentage of the fair market value that is determined by local assessors to be the total taxable value of land and additions on the property. | Land | Improvement |
|---|---|---|---|---|
| 2025 | $5,392 | $408,800 | $43,100 | $365,700 |
| 2024 | $4,938 | $359,100 | $43,100 | $316,000 |
| 2023 | $4,701 | $327,800 | $34,600 | $293,200 |
| 2022 | $4,095 | $269,200 | $27,700 | $241,500 |
| 2021 | $4,013 | $246,500 | $22,200 | $224,300 |
| 2020 | $3,681 | $216,500 | $22,200 | $194,300 |
| 2019 | $3,735 | $207,500 | $21,900 | $185,600 |
| 2018 | $3,476 | $183,800 | $21,900 | $161,900 |
| 2017 | $3,239 | $168,500 | $21,900 | $146,600 |
| 2016 | $3,190 | $154,800 | $18,700 | $136,100 |
| 2015 | $3,107 | $154,800 | $18,700 | $136,100 |
| 2014 | $3,025 | $154,800 | $18,700 | $136,100 |
Source: Public Records
Map
Nearby Homes
- 195 Millbury St
- 49 Richland St
- 13 Sigel St
- 13 Sterling St
- 82 Fox St
- 9 Winthrop St
- 79 Fox St
- 1 Arlington St
- 26 South St
- 22 Waverly St
- 172 Perry Ave Unit 1A
- 172 Perry Ave Unit 2B
- 49 South St
- 93 Fairfax Rd
- 32 Providence St Unit 5
- 64 Green St
- 9 1/2 Ames St Unit 2
- 17 Fairbanks St
- 69 Oread St
- 59 Barclay St
- 90 Endicott St Unit 1
- 90 Endicott St Unit 3
- 90 Endicott St Unit 2
- 88 Endicott St
- 88 Endicott St Unit 1
- 52 Ward St
- 54 Ward St
- 91 Endicott St
- 15 Worth St
- 19 Worth St
- 87 Endicott St
- 50 Ward St
- 21 Worth St
- 48 Ward St
- 100 Endicott St
- 100 Endicott St Unit 2
- 100 Endicott St Unit 3
- 100 Endicott St Unit 1
- 55 Ward St
- 18 Worth St
Your Personal Tour Guide
Ask me questions while you tour the home.