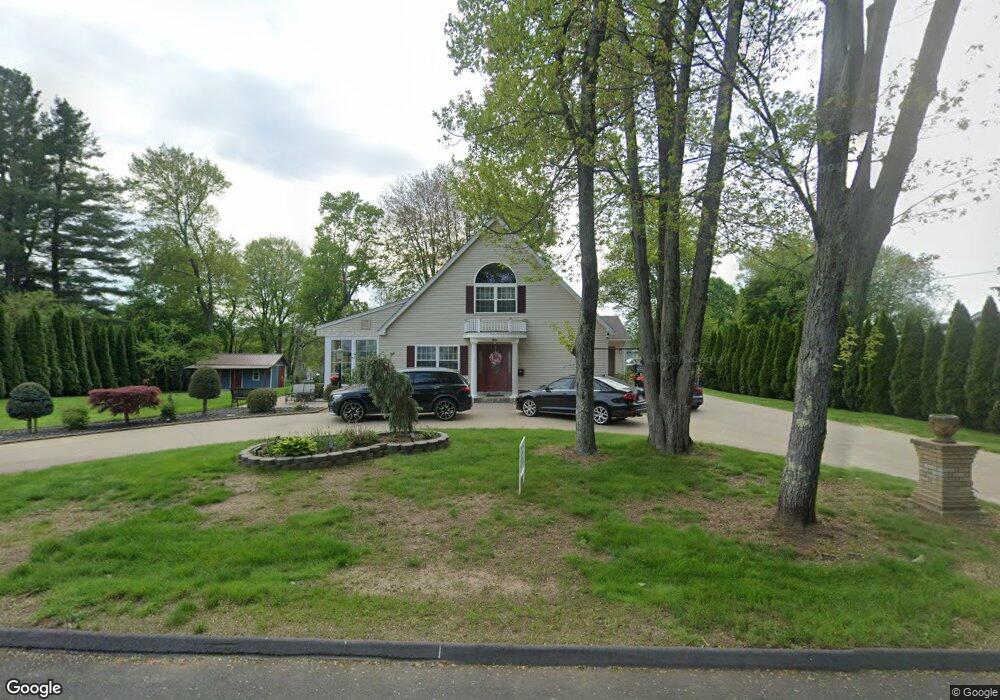
90 Orchardview St West Springfield, MA 01089
Estimated Value: $439,000 - $483,000
4
Beds
3
Baths
2,659
Sq Ft
$172/Sq Ft
Est. Value
About This Home
This home is located at 90 Orchardview St, West Springfield, MA 01089 and is currently estimated at $457,321, approximately $171 per square foot. 90 Orchardview St is a home located in Hampden County with nearby schools including St Thomas The Apostle School.
Ownership History
Date
Name
Owned For
Owner Type
Purchase Details
Closed on
Dec 23, 2003
Sold by
Turgeon Jeanne D and Turgeon Raymond F
Bought by
Gut Galina and Gut Viktor
Current Estimated Value
Home Financials for this Owner
Home Financials are based on the most recent Mortgage that was taken out on this home.
Original Mortgage
$135,000
Outstanding Balance
$62,906
Interest Rate
5.96%
Mortgage Type
Purchase Money Mortgage
Estimated Equity
$394,415
Purchase Details
Closed on
Mar 18, 2002
Sold by
Taskey John J and Taskey Mary C
Bought by
Turgeon Raymond F and Turgeon Jeanne D
Create a Home Valuation Report for This Property
The Home Valuation Report is an in-depth analysis detailing your home's value as well as a comparison with similar homes in the area
Home Values in the Area
Average Home Value in this Area
Purchase History
| Date | Buyer | Sale Price | Title Company |
|---|---|---|---|
| Gut Galina | $215,000 | -- | |
| Turgeon Raymond F | $82,000 | -- | |
| Taskey John J | $55,000 | -- |
Source: Public Records
Mortgage History
| Date | Status | Borrower | Loan Amount |
|---|---|---|---|
| Open | Gut Galina | $135,000 |
Source: Public Records
Tax History Compared to Growth
Tax History
| Year | Tax Paid | Tax Assessment Tax Assessment Total Assessment is a certain percentage of the fair market value that is determined by local assessors to be the total taxable value of land and additions on the property. | Land | Improvement |
|---|---|---|---|---|
| 2025 | $5,865 | $394,400 | $114,600 | $279,800 |
| 2024 | $5,455 | $368,300 | $114,600 | $253,700 |
| 2023 | $5,854 | $376,700 | $114,600 | $262,100 |
| 2022 | $5,380 | $341,400 | $103,900 | $237,500 |
| 2021 | $5,344 | $316,200 | $98,200 | $218,000 |
| 2020 | $5,333 | $313,900 | $98,200 | $215,700 |
| 2019 | $5,324 | $313,900 | $98,200 | $215,700 |
| 2018 | $5,352 | $313,900 | $98,200 | $215,700 |
| 2017 | $5,352 | $313,900 | $98,200 | $215,700 |
| 2016 | $5,422 | $319,100 | $94,400 | $224,700 |
| 2015 | $5,316 | $312,900 | $92,600 | $220,300 |
| 2014 | $1,292 | $312,900 | $92,600 | $220,300 |
Source: Public Records
Map
Nearby Homes
- 104 Orchardview St
- 80 Orchardview St
- 69 Almon Ave
- 59 Almon Ave
- 74 Orchardview St
- 112 Orchardview St
- 79 Almon Ave
- 95 Orchardview St
- 87 Orchardview St
- 47 Almon Ave
- 101 Orchardview St
- 79 Orchardview St
- 120 Orchardview St
- 89 Almon Ave
- 111 Orchardview St
- 60 Almon Ave
- 41 Almon Ave
- 58 Orchardview St
- 52 Almon Ave
- 80 Almon Ave