Estimated Value: $282,000 - $391,031
3
Beds
2
Baths
1,754
Sq Ft
$181/Sq Ft
Est. Value
About This Home
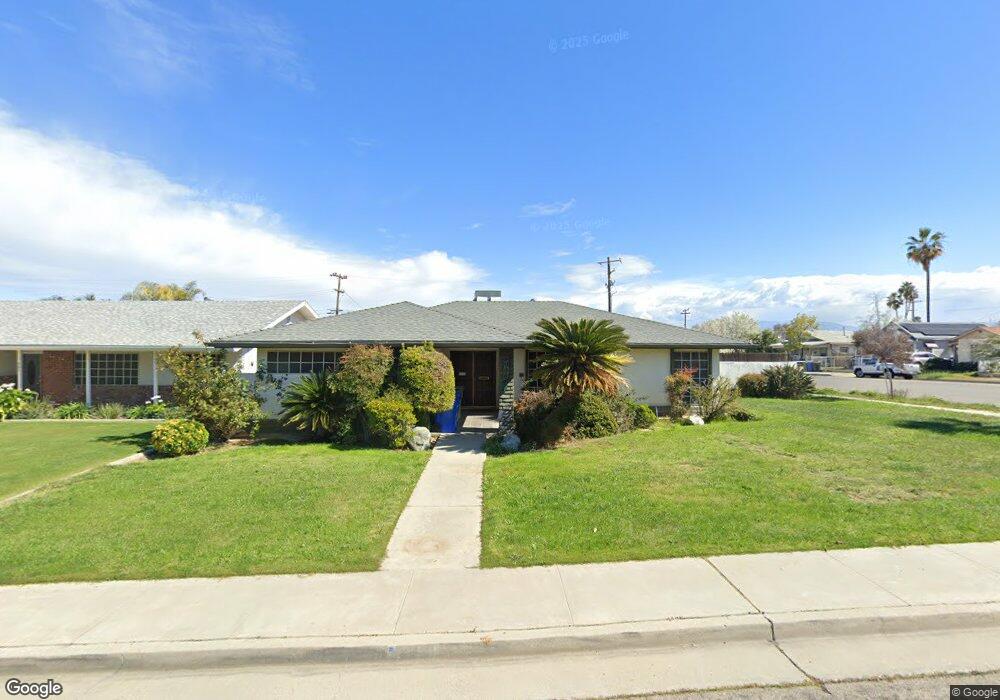
This home is located at 900 3rd St, Taft, CA 93268 and is currently estimated at $317,258, approximately $180 per square foot. 900 3rd St is a home located in Kern County with nearby schools including Taft Primary School, Roosevelt Elementary School, and Lincoln Junior High School.
Ownership History
Date
Name
Owned For
Owner Type
Purchase Details
Closed on
Oct 22, 1998
Sold by
Burch Welton H
Bought by
Moody Harold W and Moody Carmen A
Current Estimated Value
Home Financials for this Owner
Home Financials are based on the most recent Mortgage that was taken out on this home.
Original Mortgage
$94,530
Interest Rate
6.78%
Mortgage Type
FHA
Purchase Details
Closed on
Mar 6, 1995
Sold by
Burch Welton H
Bought by
Burch Welton H and Welton H Burch Revocable Trust
Create a Home Valuation Report for This Property
The Home Valuation Report is an in-depth analysis detailing your home's value as well as a comparison with similar homes in the area
Home Values in the Area
Average Home Value in this Area
Purchase History
| Date | Buyer | Sale Price | Title Company |
|---|---|---|---|
| Moody Harold W | $95,000 | Chicago Title Co | |
| Burch Welton H | -- | -- |
Source: Public Records
Mortgage History
| Date | Status | Borrower | Loan Amount |
|---|---|---|---|
| Previous Owner | Moody Harold W | $94,530 | |
| Closed | Moody Harold W | $4,726 |
Source: Public Records
Tax History
| Year | Tax Paid | Tax Assessment Tax Assessment Total Assessment is a certain percentage of the fair market value that is determined by local assessors to be the total taxable value of land and additions on the property. | Land | Improvement |
|---|---|---|---|---|
| 2025 | $2,936 | $148,910 | $23,506 | $125,404 |
| 2024 | $2,728 | $145,992 | $23,046 | $122,946 |
| 2023 | $2,728 | $143,131 | $22,595 | $120,536 |
| 2022 | $2,587 | $140,325 | $22,152 | $118,173 |
| 2021 | $2,476 | $137,574 | $21,718 | $115,856 |
| 2020 | $2,235 | $136,165 | $21,496 | $114,669 |
| 2019 | $2,207 | $136,165 | $21,496 | $114,669 |
| 2018 | $2,168 | $130,879 | $20,662 | $110,217 |
| 2017 | $2,109 | $128,313 | $20,257 | $108,056 |
| 2016 | $2,161 | $125,798 | $19,860 | $105,938 |
| 2015 | $1,987 | $123,909 | $19,562 | $104,347 |
| 2014 | $1,873 | $121,482 | $19,179 | $102,303 |
Source: Public Records
Map
Nearby Homes
Your Personal Tour Guide
Ask me questions while you tour the home.