900 E First St Crossville, TN 38555
Estimated Value: $266,000 - $324,000
3
Beds
2
Baths
1,750
Sq Ft
$163/Sq Ft
Est. Value
About This Home
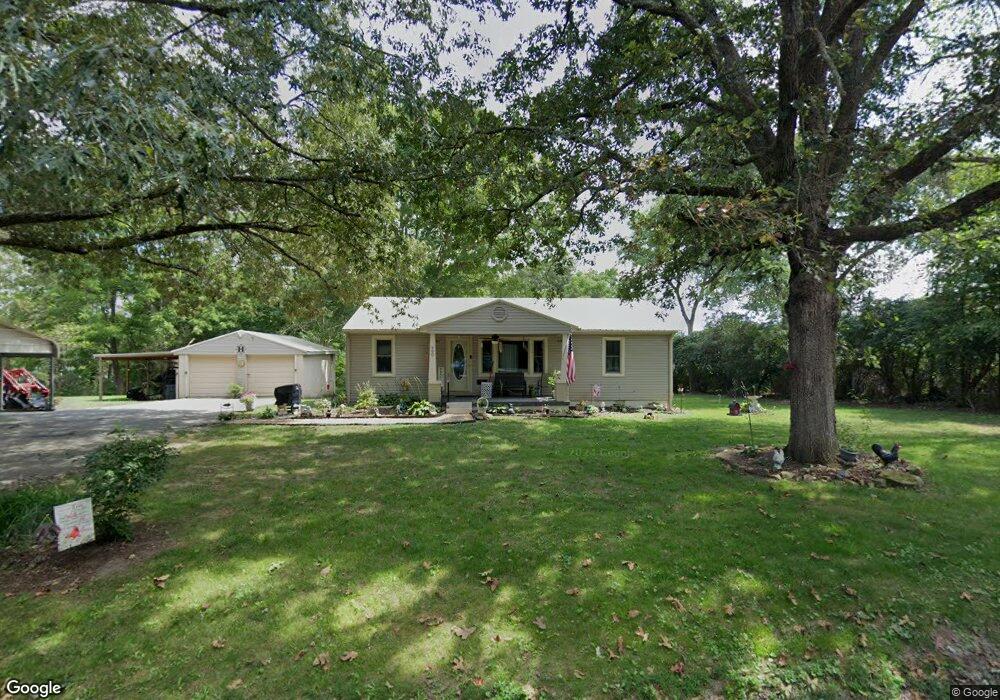
This home is located at 900 E First St, Crossville, TN 38555 and is currently estimated at $284,492, approximately $162 per square foot. 900 E First St is a home located in Cumberland County with nearby schools including Cumberland County High School, Christian Academy of the Cumberlands, and Crossville Christian School.
Ownership History
Date
Name
Owned For
Owner Type
Purchase Details
Closed on
Dec 23, 2020
Sold by
Macri Alex
Bought by
Reeds Jack W and Reeds Sandra D
Current Estimated Value
Purchase Details
Closed on
Mar 19, 2019
Sold by
Ettner Cassandra L
Bought by
Wilson Steven Ray and Wilson Ratha Lynn
Purchase Details
Closed on
Mar 14, 2018
Sold by
Colonial Square Llc
Bought by
Bertram Robert A and Bertram Karen A
Purchase Details
Closed on
Jan 4, 2018
Sold by
Martin Harvey
Bought by
Avitabile Sherryl K and Avitabile Francis C
Purchase Details
Closed on
Aug 13, 2009
Sold by
Hale Christy R
Bought by
Hale Jeramy E
Purchase Details
Closed on
Nov 8, 2006
Bought by
Hale Jeramy E and Hale Christy R
Home Financials for this Owner
Home Financials are based on the most recent Mortgage that was taken out on this home.
Original Mortgage
$88,000
Interest Rate
6.31%
Purchase Details
Closed on
Oct 2, 2000
Sold by
Kirby Douglas
Bought by
Pugh Christopher
Create a Home Valuation Report for This Property
The Home Valuation Report is an in-depth analysis detailing your home's value as well as a comparison with similar homes in the area
Purchase History
| Date | Buyer | Sale Price | Title Company |
|---|---|---|---|
| Reeds Jack W | $20,000 | None Available | |
| Wilson Steven Ray | $150,000 | Looney & Chadwell Title Svcs | |
| Bertram Robert A | $140,000 | None Available | |
| Avitabile Sherryl K | $92,000 | None Available | |
| Hale Jeramy E | -- | -- | |
| Hale Jeramy E | $110,000 | -- | |
| Pugh Christopher | $60,000 | -- |
Source: Public Records
Mortgage History
| Date | Status | Borrower | Loan Amount |
|---|---|---|---|
| Previous Owner | Pugh Christopher | $88,000 | |
| Previous Owner | Pugh Christopher | $22,000 |
Source: Public Records
Tax History
| Year | Tax Paid | Tax Assessment Tax Assessment Total Assessment is a certain percentage of the fair market value that is determined by local assessors to be the total taxable value of land and additions on the property. | Land | Improvement |
|---|---|---|---|---|
| 2025 | -- | $42,250 | $7,300 | $34,950 |
| 2024 | -- | $42,250 | $7,300 | $34,950 |
| 2023 | $480 | $42,250 | $0 | $0 |
| 2022 | $736 | $42,250 | $7,300 | $34,950 |
| 2021 | $591 | $25,525 | $7,300 | $18,225 |
| 2020 | $400 | $25,525 | $7,300 | $18,225 |
| 2019 | $551 | $25,525 | $7,300 | $18,225 |
| 2018 | $551 | $25,525 | $7,300 | $18,225 |
| 2017 | $551 | $25,525 | $7,300 | $18,225 |
| 2016 | $554 | $25,650 | $7,300 | $18,350 |
| 2015 | $546 | $25,650 | $7,300 | $18,350 |
| 2014 | $520 | $25,661 | $0 | $0 |
Source: Public Records
Map
Nearby Homes
- 3 Cook Rd
- 96 County Garage Rd
- 290 County Garage Rd
- 24 Diane St
- 197 Panther Valley Rd
- 356 Dayton Ave
- 101 Dayton Ave
- 141 Dogwood Ave
- 36 Hunter Dr
- 34 Hampton Square
- 148 Hassler Ln
- 181 Braun St
- 0 S Main St - 31 Acres
- 1151 Cook Rd
- 1161 Cook Rd
- 00 The Terrace
- 1252 Cook Rd
- 484 Wells Rd
- 78 Elmo Dr
- 80 Mclarty Ln
Your Personal Tour Guide
Ask me questions while you tour the home.