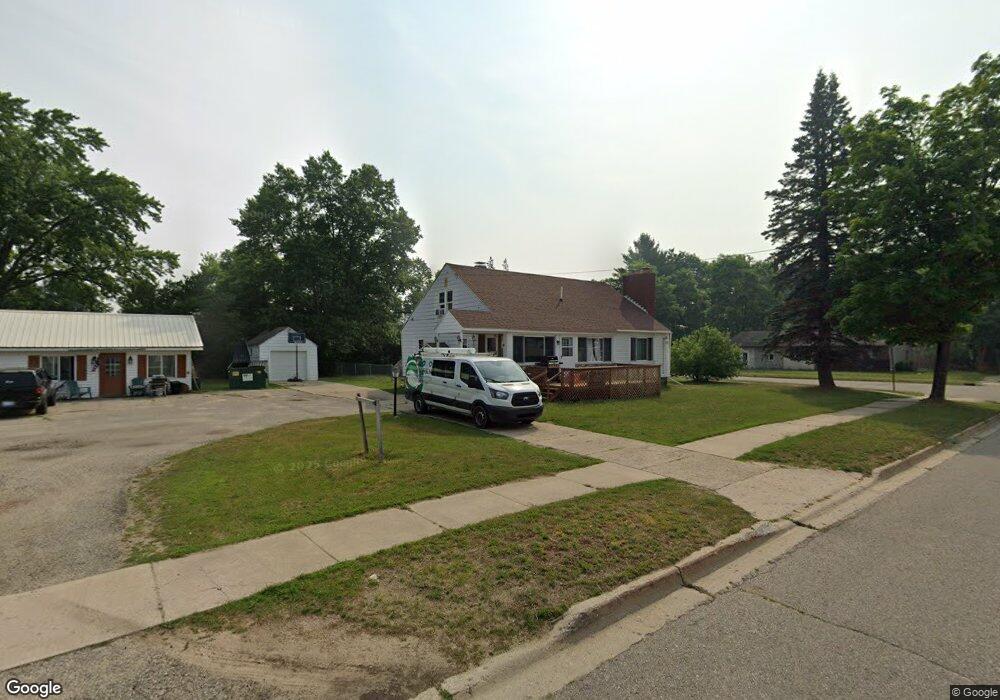
900 Maple St Grayling, MI 49738
Estimated Value: $123,000 - $188,000
Studio
--
Bath
4,612
Sq Ft
$31/Sq Ft
Est. Value
About This Home
This home is located at 900 Maple St, Grayling, MI 49738 and is currently estimated at $144,821, approximately $31 per square foot. 900 Maple St is a home located in Crawford County with nearby schools including Grayling Elementary School, Grayling Middle School, and Grayling High School.
Ownership History
Date
Name
Owned For
Owner Type
Purchase Details
Closed on
Nov 14, 2013
Sold by
Singh Sawan and Kaur Paul
Bought by
Singh & Kaur Rentals Llc
Current Estimated Value
Purchase Details
Closed on
Jun 22, 2005
Sold by
Lund William J and Lund Kathleen E
Bought by
Behme Lawrence and Behme Theresa
Purchase Details
Closed on
Aug 29, 2003
Sold by
Lund William J and Lund Kathleen E
Bought by
Behme Lawrence and Behme Theresa
Purchase Details
Closed on
Aug 27, 2003
Bought by
Lund William J and Lund Kathleen E
Purchase Details
Closed on
Aug 7, 2003
Bought by
Lund William and Lund Kathleen
Purchase Details
Closed on
Mar 6, 2002
Sold by
Lad Bhavesh H
Bought by
Citizens Bank
Purchase Details
Closed on
Apr 5, 2000
Sold by
Lad Bhavesh H
Bought by
Patel Kishor and Patel Geetaban
Purchase Details
Closed on
Oct 12, 1998
Sold by
Smith Timothy and Wf Eleanor
Bought by
Lad Bhavesh H
Purchase Details
Closed on
Jun 15, 1995
Sold by
Lund William and Wf Kathleen
Bought by
Smith Timothy and Wf Eleanor
Purchase Details
Closed on
Apr 14, 1995
Sold by
Hayes Howard A
Bought by
Wf Lund W and Wf Kathleen
Create a Home Valuation Report for This Property
The Home Valuation Report is an in-depth analysis detailing your home's value as well as a comparison with similar homes in the area
Home Values in the Area
Average Home Value in this Area
Purchase History
| Date | Buyer | Sale Price | Title Company |
|---|---|---|---|
| Singh & Kaur Rentals Llc | -- | -- | |
| Behme Lawrence | -- | -- | |
| Behme Lawrence | -- | -- | |
| Lund William J | -- | -- | |
| Lund William | -- | -- | |
| Citizens Bank | -- | -- | |
| Patel Kishor | -- | -- | |
| Lad Bhavesh H | $205,000 | -- | |
| Smith Timothy | -- | -- | |
| Lund William | -- | -- | |
| Wf Lund W | $218,400 | -- |
Source: Public Records
Tax History
| Year | Tax Paid | Tax Assessment Tax Assessment Total Assessment is a certain percentage of the fair market value that is determined by local assessors to be the total taxable value of land and additions on the property. | Land | Improvement |
|---|---|---|---|---|
| 2025 | $1,321 | $53,500 | $53,500 | $0 |
| 2024 | $1,291 | $49,500 | $49,500 | $0 |
| 2023 | $1,235 | $43,500 | $43,500 | $0 |
| 2022 | $1,174 | $38,700 | $38,700 | $0 |
| 2021 | $1,334 | $34,000 | $34,000 | $0 |
| 2020 | $1,316 | $33,100 | $33,100 | $0 |
| 2019 | $1,288 | $32,100 | $32,100 | $0 |
| 2018 | $1,263 | $30,500 | $30,500 | $0 |
| 2017 | $1,100 | $30,800 | $30,800 | $0 |
| 2016 | $1,090 | $19,600 | $19,600 | $0 |
| 2015 | -- | $19,600 | $0 | $0 |
| 2014 | -- | $20,400 | $0 | $0 |
| 2013 | -- | $21,600 | $0 | $0 |
Source: Public Records
Map
Nearby Homes
- 809 Maple St
- 1024 S I-75 Business Loop
- 704 Elm St
- 601 Peninsular Ave
- Lot 4 Erie St
- 1205 E Michigan Ave
- 205 Park St
- 000 W M-72 Hwy
- V/L L71-75 Evergreen Dr
- 110 State St
- 109 Madsen St
- 4593 Orbit Dr
- 5973 W M-72 Hwy
- 300 Rolla St
- 4900 Helen Dr
- 6960 Trem Pal Rd
- V/L Lot 9 Norseman Dr
- V/L Lot 2 Norseman Dr
- V/L Lot 10 Norseman Dr
- V/L Lot 1 Norseman Dr
- 903 Park St
- 901 Park St
- 905 Park St
- 600 Smith St
- 901 Maple St
- 1155 Interstate 75 Business Loop
- 909 Park St
- 808 Maple St
- 1169 N I-75 Business
- 1169 Interstate 75 Business Loop
- 604 Smith St
- 1169 S I 75 Business Loop
- 1169 Business Loop I-75
- 900 Park St
- 807 Maple St
- 1081 I-75bl
- 0 Park St
- 904 Park St
- 810 Chestnut St
- 906 Park St
Your Personal Tour Guide
Ask me questions while you tour the home.