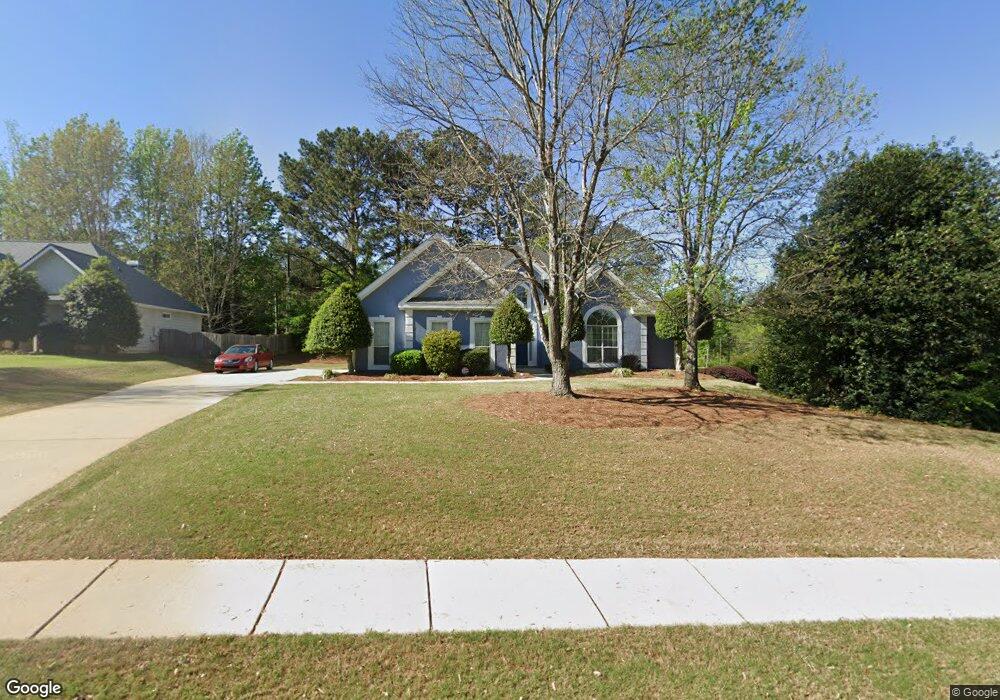
900 Shadow Ridge Cir Stockbridge, GA 30281
Estimated Value: $318,524 - $347,000
3
Beds
3
Baths
1,946
Sq Ft
$169/Sq Ft
Est. Value
About This Home
This home is located at 900 Shadow Ridge Cir, Stockbridge, GA 30281 and is currently estimated at $329,381, approximately $169 per square foot. 900 Shadow Ridge Cir is a home located in Henry County with nearby schools including Pate's Creek Elementary School, Dutchtown Middle School, and Dutchtown High School.
Ownership History
Date
Name
Owned For
Owner Type
Purchase Details
Closed on
Nov 10, 2018
Sold by
Cania Lisa H
Bought by
Shannon Mark and Shannon Gail M
Current Estimated Value
Purchase Details
Closed on
Feb 23, 2001
Sold by
Cania Anthony J
Bought by
Cania Lisa H
Home Financials for this Owner
Home Financials are based on the most recent Mortgage that was taken out on this home.
Original Mortgage
$131,341
Interest Rate
7.12%
Mortgage Type
New Conventional
Purchase Details
Closed on
Aug 28, 1996
Sold by
Christian Homes
Bought by
Cania Anthony J Lisa H
Create a Home Valuation Report for This Property
The Home Valuation Report is an in-depth analysis detailing your home's value as well as a comparison with similar homes in the area
Home Values in the Area
Average Home Value in this Area
Purchase History
| Date | Buyer | Sale Price | Title Company |
|---|---|---|---|
| Shannon Mark | $1,999,900 | -- | |
| Cania Lisa H | -- | -- | |
| Cania Anthony J Lisa H | $133,700 | -- |
Source: Public Records
Mortgage History
| Date | Status | Borrower | Loan Amount |
|---|---|---|---|
| Previous Owner | Cania Lisa H | $131,341 | |
| Closed | Cania Anthony J Lisa H | $0 |
Source: Public Records
Tax History Compared to Growth
Tax History
| Year | Tax Paid | Tax Assessment Tax Assessment Total Assessment is a certain percentage of the fair market value that is determined by local assessors to be the total taxable value of land and additions on the property. | Land | Improvement |
|---|---|---|---|---|
| 2025 | $1,137 | $138,400 | $16,000 | $122,400 |
| 2024 | $1,137 | $136,720 | $16,000 | $120,720 |
| 2023 | $868 | $135,080 | $14,000 | $121,080 |
| 2022 | $1,568 | $105,840 | $14,000 | $91,840 |
| 2021 | $1,195 | $90,040 | $14,000 | $76,040 |
| 2020 | $1,002 | $81,880 | $12,000 | $69,880 |
| 2019 | $2,197 | $74,840 | $10,000 | $64,840 |
| 2018 | $2,197 | $62,360 | $10,000 | $52,360 |
| 2016 | $1,953 | $56,000 | $8,000 | $48,000 |
| 2015 | $2,102 | $58,520 | $8,000 | $50,520 |
| 2014 | $1,789 | $50,160 | $8,000 | $42,160 |
Source: Public Records
Map
Nearby Homes
- 53 Overlook Heights Way
- 837 Ravins Way
- 191 Pine Branch Dr
- 215 Pine Branch Dr
- 213 Chiswick Loop
- Pelham Plan at Burchwood
- Wagener Plan at Burchwood
- Wynwood Plan at Burchwood
- Ridgewood Plan at Burchwood
- 236 Chiswick Loop
- 220 Chiswick Loop
- 124 Dalston Cove
- 240 Plantation Blvd
- 115 Dalston Cove
- 300 Jeremys Straight
- 503 Horseshoe Cir
- 539 Horseshoe Cir
- 147 Dalston Cove
- 143 Dalston Cove
- 277 Chiswick Loop
- 904 Shadow Ridge Cir
- 908 Shadow Ridge Cir
- 40 Walden Trail
- 1930 Jodeco Rd
- 905 Shadow Ridge Cir
- 44 Walden Trail
- 1823 Jodeco Rd
- 909 Shadow Ridge Cir
- 51 Overlook Heights Way
- 51 Overlook Heights Way Unit 1
- 20 Helen Ln Unit 1, 2, & 3
- 20 Helen Ln
- 916 Shadow Ridge Cir
- 913 Shadow Ridge Cir
- 800 Ravins Way
- 804 Ravins Way
- 808 Ravins Way
- 1837 Jodeco Rd
- 812 Ravins Way
- 57 Overlook Heights Way