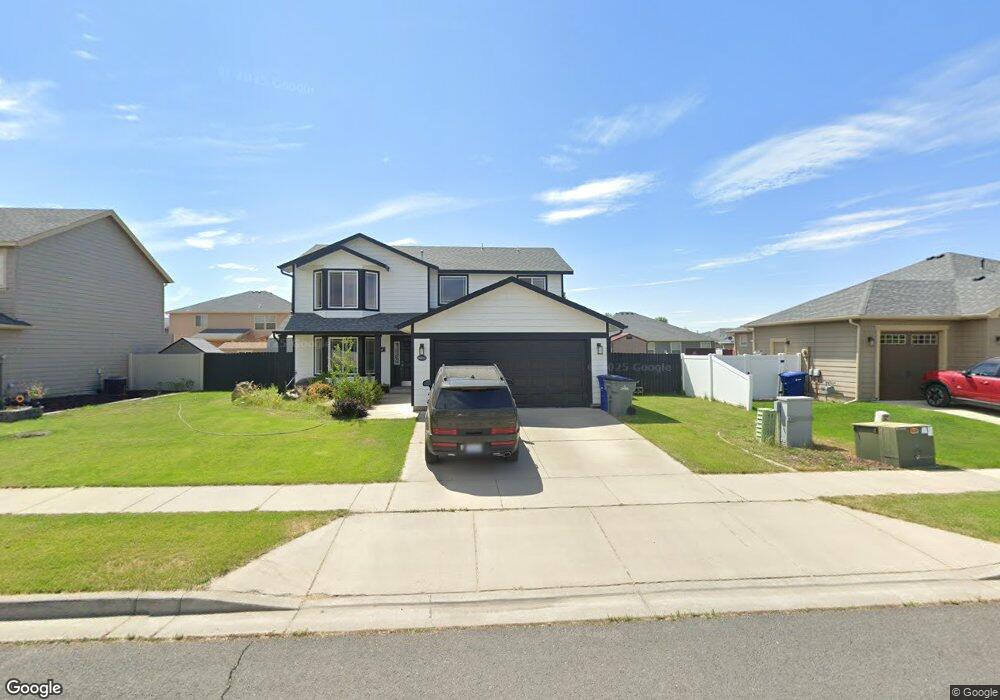
9007 W Red St Cheney, WA 99004
Thorpe Westwood NeighborhoodEstimated Value: $453,148 - $474,000
4
Beds
3
Baths
2,222
Sq Ft
$208/Sq Ft
Est. Value
About This Home
This home is located at 9007 W Red St, Cheney, WA 99004 and is currently estimated at $462,537, approximately $208 per square foot. 9007 W Red St is a home located in Spokane County with nearby schools including Phil Snowdon Elementary School, Westwood Middle School, and Cheney High School.
Ownership History
Date
Name
Owned For
Owner Type
Purchase Details
Closed on
Mar 26, 2012
Sold by
Marlow Sean
Bought by
Marlow Sean and Marlow Dana
Current Estimated Value
Home Financials for this Owner
Home Financials are based on the most recent Mortgage that was taken out on this home.
Original Mortgage
$199,845
Outstanding Balance
$137,644
Interest Rate
3.85%
Mortgage Type
VA
Estimated Equity
$324,893
Purchase Details
Closed on
Sep 7, 2010
Sold by
Aho Construction I Inc
Bought by
Marlow Sean
Home Financials for this Owner
Home Financials are based on the most recent Mortgage that was taken out on this home.
Original Mortgage
$203,176
Interest Rate
4.38%
Mortgage Type
VA
Create a Home Valuation Report for This Property
The Home Valuation Report is an in-depth analysis detailing your home's value as well as a comparison with similar homes in the area
Home Values in the Area
Average Home Value in this Area
Purchase History
| Date | Buyer | Sale Price | Title Company |
|---|---|---|---|
| Marlow Sean | -- | None Available | |
| Marlow Sean | $199,180 | Stewart Title Of Spokane |
Source: Public Records
Mortgage History
| Date | Status | Borrower | Loan Amount |
|---|---|---|---|
| Open | Marlow Sean | $199,845 | |
| Closed | Marlow Sean | $203,176 |
Source: Public Records
Tax History
| Year | Tax Paid | Tax Assessment Tax Assessment Total Assessment is a certain percentage of the fair market value that is determined by local assessors to be the total taxable value of land and additions on the property. | Land | Improvement |
|---|---|---|---|---|
| 2025 | $4,200 | $446,000 | $95,000 | $351,000 |
| 2024 | $4,200 | $430,200 | $90,000 | $340,200 |
| 2023 | $3,630 | $435,500 | $70,000 | $365,500 |
| 2022 | $3,512 | $435,500 | $70,000 | $365,500 |
| 2021 | $3,314 | $298,800 | $48,000 | $250,800 |
| 2020 | $3,123 | $269,300 | $40,000 | $229,300 |
| 2019 | $2,567 | $233,100 | $35,000 | $198,100 |
| 2018 | $2,852 | $220,000 | $35,000 | $185,000 |
| 2017 | $2,405 | $206,300 | $30,000 | $176,300 |
| 2016 | $2,429 | $198,900 | $30,000 | $168,900 |
| 2015 | $2,309 | $180,600 | $30,000 | $150,600 |
| 2014 | -- | $176,300 | $30,000 | $146,300 |
| 2013 | -- | $0 | $0 | $0 |
Source: Public Records
Map
Nearby Homes
- 5811 S Holly Rd
- 7011 S Mudlen St
- 57xx S Thomas Mallen Rd
- 7003 S West Terrace Dr
- 7106 S Hever St
- 6624 S Lucas St
- 6710 S Lucas St
- 9426 W Claire Ave
- 7912 Zabo Rd
- 7912 W Zabo Rd
- 7908 Zabo Rd
- 5887 Zabo Rd
- 5882 Zabo Rd
- 5882 S Zabo Rd
- 5883 Zabo Rd
- 5864 Zabo Rd
- 5867 S Zabo Rd
- 5834 Zabo Rd
- 5848 S Zabo Rd
- 5857 Zabo Rd
Your Personal Tour Guide
Ask me questions while you tour the home.