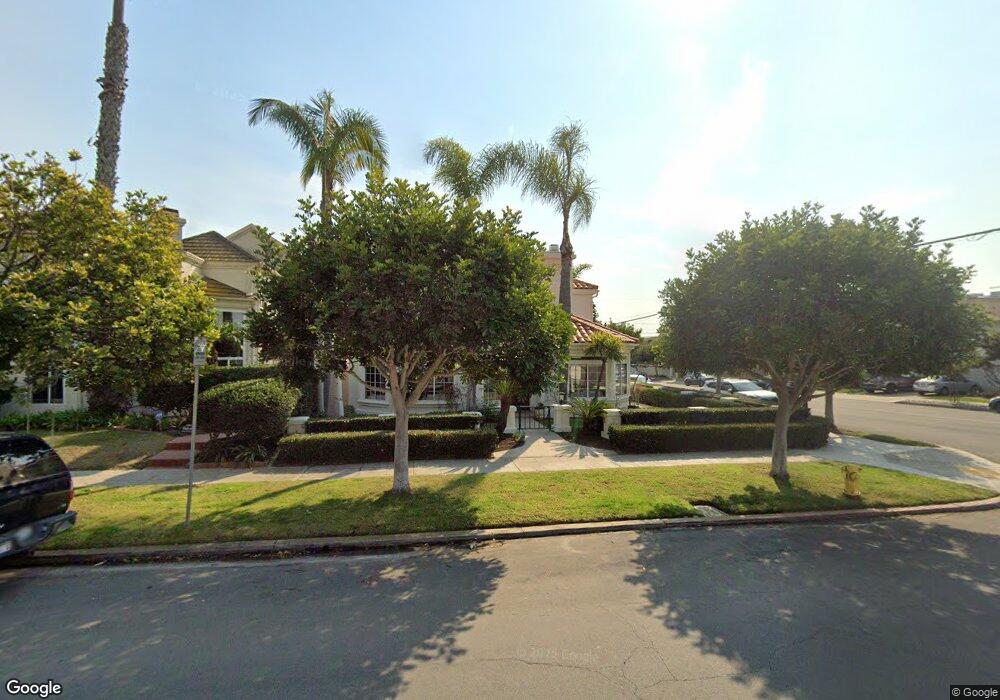
901 Beryl St Unit L2 San Diego, CA 92109
Pacific Beach NeighborhoodEstimated Value: $1,697,000 - $3,123,000
3
Beds
3
Baths
2,000
Sq Ft
$1,129/Sq Ft
Est. Value
About This Home
This home is located at 901 Beryl St Unit L2, San Diego, CA 92109 and is currently estimated at $2,257,091, approximately $1,128 per square foot. 901 Beryl St Unit L2 is a home located in San Diego County with nearby schools including Pacific Beach Elementary School, Pacific Beach Middle, and Mission Bay High School.
Ownership History
Date
Name
Owned For
Owner Type
Purchase Details
Closed on
Apr 9, 2015
Sold by
Mccabe Stanley M and Mccabe Antoinette
Bought by
Griggs Revocable Trust
Current Estimated Value
Home Financials for this Owner
Home Financials are based on the most recent Mortgage that was taken out on this home.
Original Mortgage
$700,000
Outstanding Balance
$538,677
Interest Rate
3.73%
Mortgage Type
New Conventional
Estimated Equity
$1,718,414
Purchase Details
Closed on
May 22, 2014
Sold by
Russell Michael B and Russell Debra F
Bought by
Mccabe Stanley M and Mccabe Antoinette
Purchase Details
Closed on
Apr 1, 1996
Sold by
Hall Linda L
Bought by
Russell Michael B and Russell Debra F
Home Financials for this Owner
Home Financials are based on the most recent Mortgage that was taken out on this home.
Original Mortgage
$267,200
Interest Rate
7.97%
Purchase Details
Closed on
Sep 24, 1990
Purchase Details
Closed on
Jul 31, 1990
Create a Home Valuation Report for This Property
The Home Valuation Report is an in-depth analysis detailing your home's value as well as a comparison with similar homes in the area
Home Values in the Area
Average Home Value in this Area
Purchase History
| Date | Buyer | Sale Price | Title Company |
|---|---|---|---|
| Griggs Revocable Trust | $1,250,000 | Corinthian Title Company | |
| Mccabe Stanley M | $1,125,000 | Corinthian Title Company | |
| Russell Michael B | $334,000 | Guardian Title Company | |
| -- | $450,000 | -- | |
| -- | $308,800 | -- |
Source: Public Records
Mortgage History
| Date | Status | Borrower | Loan Amount |
|---|---|---|---|
| Open | Griggs Revocable Trust | $700,000 | |
| Previous Owner | Russell Michael B | $267,200 |
Source: Public Records
Tax History Compared to Growth
Tax History
| Year | Tax Paid | Tax Assessment Tax Assessment Total Assessment is a certain percentage of the fair market value that is determined by local assessors to be the total taxable value of land and additions on the property. | Land | Improvement |
|---|---|---|---|---|
| 2025 | $18,132 | $1,502,302 | $1,081,661 | $420,641 |
| 2024 | $18,132 | $1,472,846 | $1,060,452 | $412,394 |
| 2023 | $17,733 | $1,443,967 | $1,039,659 | $404,308 |
| 2022 | $17,262 | $1,415,655 | $1,019,274 | $396,381 |
| 2021 | $17,143 | $1,387,898 | $999,289 | $388,609 |
| 2020 | $16,935 | $1,373,668 | $989,043 | $384,625 |
| 2019 | $16,633 | $1,346,734 | $969,650 | $377,084 |
| 2018 | $15,549 | $1,320,329 | $950,638 | $369,691 |
| 2017 | $80 | $1,294,442 | $931,999 | $362,443 |
| 2016 | $14,941 | $1,269,062 | $913,725 | $355,337 |
| 2015 | $13,516 | $1,147,477 | $790,484 | $356,993 |
| 2014 | $5,292 | $452,615 | $271,030 | $181,585 |
Source: Public Records
Map
Nearby Homes
- 4944 Cass St Unit 604
- 4944 Cass St Unit 407
- 1025 Wilbur Ave
- 938 Opal St
- 4767 Ocean Blvd
- 4767 Ocean Blvd Unit 411
- 4667 Ocean Blvd Unit 106
- 972 Sapphire St Unit LA1
- 974 Sapphire St Unit LA2
- 976 Sapphire St Unit LA3
- 835 Felspar St Week 6
- 1220 Emerald St
- 751-63 Turquoise St Unit 27-30
- 1154 Sapphire St
- 1270 Emerald St
- 4475 Mission Blvd Unit 1
- 1059 Agate St Unit A
- 1148 Turquoise St
- 4465 Ocean Blvd Unit 1
- 866 Grand Ave
- 4887 Bayard St
- 905 Beryl St Unit 2
- 905 Beryl St Unit 1
- 915 Beryl St
- 915 Beryl St Unit 3
- 915 Beryl St Unit 2
- 915 Beryl St Unit 1
- 915 Beryl St Unit 4
- 4878 Bayard St Unit 90
- 927 Beryl St # 3
- 927 Beryl St
- 927 Beryl St Unit 4
- 927 Beryl St Unit 3
- 927 Beryl St Unit 2
- 927 Beryl St Unit 1
- 910-16 Law St
- 904 Law St Unit 9041/2
- 910 Law St Unit 16
- 904 Beryl St
- 867 Beryl St Unit 69