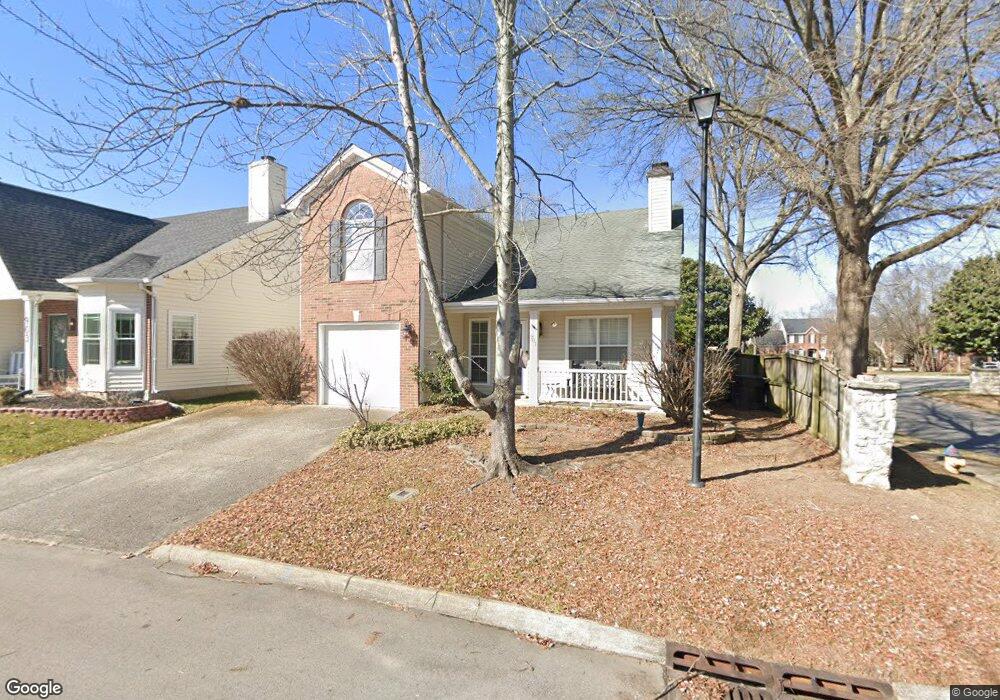
901 Idlewild Ct Franklin, TN 37069
Berrys Chapel NeighborhoodEstimated Value: $468,020 - $551,000
Studio
3
Baths
1,485
Sq Ft
$349/Sq Ft
Est. Value
About This Home
This home is located at 901 Idlewild Ct, Franklin, TN 37069 and is currently estimated at $518,505, approximately $349 per square foot. 901 Idlewild Ct is a home located in Williamson County with nearby schools including Hunters Bend Elementary School, Grassland Middle School, and Franklin High School.
Ownership History
Date
Name
Owned For
Owner Type
Purchase Details
Closed on
May 23, 2007
Sold by
Fuqua Susan Patten and Fuqua Susan Patton
Bought by
Fuqua Susan Patten
Current Estimated Value
Home Financials for this Owner
Home Financials are based on the most recent Mortgage that was taken out on this home.
Original Mortgage
$103,850
Outstanding Balance
$14,659
Interest Rate
6.52%
Mortgage Type
New Conventional
Estimated Equity
$503,846
Purchase Details
Closed on
Nov 25, 1997
Sold by
Ross Harold E and Ross Linda L
Bought by
Fuqua Susan Patton
Home Financials for this Owner
Home Financials are based on the most recent Mortgage that was taken out on this home.
Original Mortgage
$111,920
Interest Rate
7.35%
Mortgage Type
Balloon
Purchase Details
Closed on
Mar 14, 1996
Sold by
American Gen Realty Inv
Bought by
Ross Harold E and Ross Linda L
Create a Home Valuation Report for This Property
The Home Valuation Report is an in-depth analysis detailing your home's value as well as a comparison with similar homes in the area
Home Values in the Area
Average Home Value in this Area
Purchase History
| Date | Buyer | Sale Price | Title Company |
|---|---|---|---|
| Fuqua Susan Patten | -- | Accommodation | |
| Fuqua Susan Patton | $139,900 | Centennial Title Company Inc | |
| Ross Harold E | $121,062 | -- |
Source: Public Records
Mortgage History
| Date | Status | Borrower | Loan Amount |
|---|---|---|---|
| Open | Fuqua Susan Patten | $103,850 | |
| Closed | Fuqua Susan Patton | $111,920 |
Source: Public Records
Tax History
| Year | Tax Paid | Tax Assessment Tax Assessment Total Assessment is a certain percentage of the fair market value that is determined by local assessors to be the total taxable value of land and additions on the property. | Land | Improvement |
|---|---|---|---|---|
| 2025 | $932 | $124,250 | $45,000 | $79,250 |
| 2024 | $932 | $89,600 | $23,750 | $65,850 |
| 2023 | $932 | $89,600 | $23,750 | $65,850 |
| 2022 | $1,932 | $89,600 | $23,750 | $65,850 |
| 2021 | $1,932 | $89,600 | $23,750 | $65,850 |
| 2020 | $1,759 | $68,250 | $16,250 | $52,000 |
| 2019 | $1,759 | $68,250 | $16,250 | $52,000 |
| 2018 | $1,711 | $68,250 | $16,250 | $52,000 |
| 2017 | $1,698 | $68,250 | $16,250 | $52,000 |
Source: Public Records
Map
Nearby Homes
- 902 Idlewild Ct
- 2002 Glastonbury Dr
- 3033 Wilcot Way
- 108 Ben Brush Cir
- 82 Heaton Close Unit 82
- 312 Hanley Ln
- 99 Somerton Park Unit 99
- 426 Essex Park Cir
- 38 Prescott Place Unit 38
- 406 Reigh Ct
- 163 Clarendon Cir
- 346 Colt Ln
- 18 Holland Park Ln Unit 18
- 511 Arbor Dr
- 113 Pine Circle Dr
- 512 Meadowgreen Dr
- 211 Eastgate Crescent Place
- 604 Meadowgreen Dr
- 210 Cotton Ln
- 492 Sadler Way
- 903 Idlewild Ct
- 905 Idlewild Ct
- 823 Brandyleigh Ct
- 907 Idlewild Ct
- 817 Brandyleigh Ct
- 825 Brandyleigh Ct
- 900 Idlewild Ct
- 904 Idlewild Ct
- 801 Brandyleigh Ct
- 909 Idlewild Ct
- 906 Idlewild Ct
- 2000 Belmont Cir
- 2002 Belmont Cir
- 803 Brandyleigh Ct
- 827 Brandyleigh Ct
- 908 Idlewild Ct
- 911 Idlewild Ct
- 701 Wayside Ct
- 703 Wayside Ct
- 2004 Belmont Cir
Your Personal Tour Guide
Ask me questions while you tour the home.