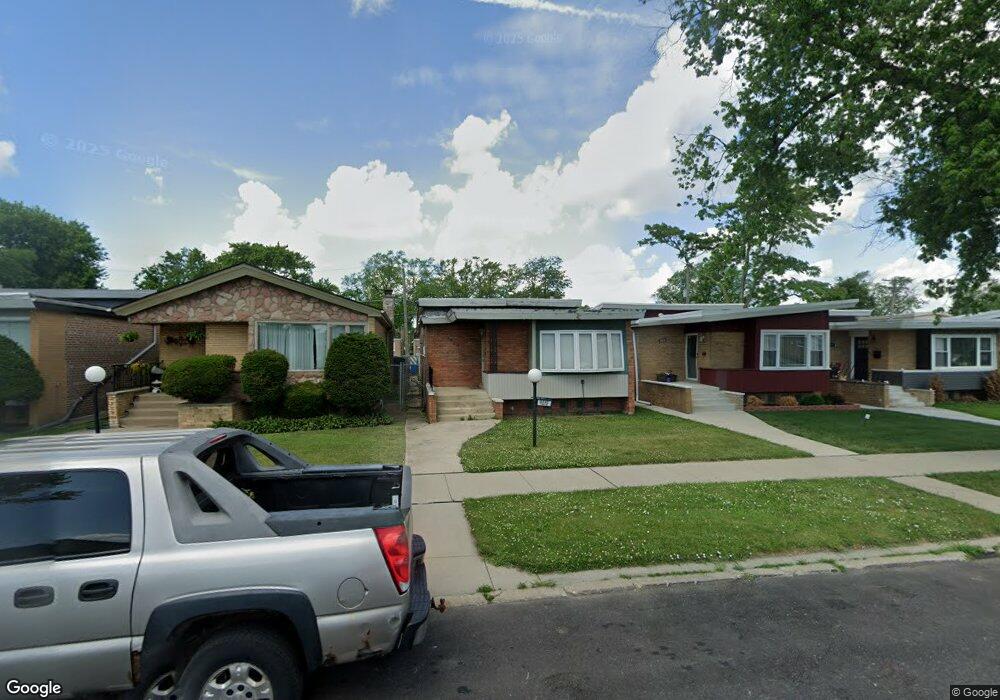
9010 S Oglesby Ave Chicago, IL 60617
Calumet Heights NeighborhoodEstimated Value: $181,000 - $315,000
3
Beds
1
Bath
1,108
Sq Ft
$229/Sq Ft
Est. Value
About This Home
This home is located at 9010 S Oglesby Ave, Chicago, IL 60617 and is currently estimated at $254,159, approximately $229 per square foot. 9010 S Oglesby Ave is a home located in Cook County with nearby schools including Warren Elementary School and Hoyne Elementary School.
Ownership History
Date
Name
Owned For
Owner Type
Purchase Details
Closed on
Feb 22, 2023
Sold by
Johnson Brian
Bought by
Brian J Johnson Revocable Living Trust
Current Estimated Value
Purchase Details
Closed on
Mar 1, 2004
Sold by
Kimble Donald H
Bought by
Johnson Brian
Home Financials for this Owner
Home Financials are based on the most recent Mortgage that was taken out on this home.
Original Mortgage
$139,120
Interest Rate
8.1%
Mortgage Type
Unknown
Purchase Details
Closed on
Jan 10, 2002
Sold by
Brown Frederick
Bought by
Kimble Donald H
Home Financials for this Owner
Home Financials are based on the most recent Mortgage that was taken out on this home.
Original Mortgage
$114,733
Interest Rate
6.87%
Mortgage Type
FHA
Purchase Details
Closed on
Jun 6, 1913
Sold by
Montgomery Jareen
Bought by
Deshazer Birdia M
Home Financials for this Owner
Home Financials are based on the most recent Mortgage that was taken out on this home.
Original Mortgage
$86,900
Interest Rate
8.29%
Mortgage Type
FHA
Create a Home Valuation Report for This Property
The Home Valuation Report is an in-depth analysis detailing your home's value as well as a comparison with similar homes in the area
Home Values in the Area
Average Home Value in this Area
Purchase History
| Date | Buyer | Sale Price | Title Company |
|---|---|---|---|
| Brian J Johnson Revocable Living Trust | -- | None Listed On Document | |
| Johnson Brian | $174,000 | Git | |
| Kimble Donald H | $92,900 | -- | |
| Deshazer Birdia M | $87,000 | Attorneys Natl Title Network |
Source: Public Records
Mortgage History
| Date | Status | Borrower | Loan Amount |
|---|---|---|---|
| Previous Owner | Johnson Brian | $139,120 | |
| Previous Owner | Kimble Donald H | $114,733 | |
| Previous Owner | Deshazer Birdia M | $86,900 | |
| Closed | Johnson Brian | $34,780 |
Source: Public Records
Tax History Compared to Growth
Tax History
| Year | Tax Paid | Tax Assessment Tax Assessment Total Assessment is a certain percentage of the fair market value that is determined by local assessors to be the total taxable value of land and additions on the property. | Land | Improvement |
|---|---|---|---|---|
| 2024 | $2,683 | $16,701 | $2,813 | $13,888 |
| 2023 | $2,595 | $16,001 | $4,688 | $11,313 |
| 2022 | $2,595 | $16,001 | $4,688 | $11,313 |
| 2021 | $2,555 | $15,999 | $4,687 | $11,312 |
| 2020 | $1,693 | $10,682 | $3,375 | $7,307 |
| 2019 | $1,674 | $11,739 | $3,375 | $8,364 |
| 2018 | $1,644 | $11,739 | $3,375 | $8,364 |
| 2017 | $1,950 | $12,414 | $3,000 | $9,414 |
| 2016 | $1,991 | $12,414 | $3,000 | $9,414 |
| 2015 | $1,799 | $12,414 | $3,000 | $9,414 |
| 2014 | $1,781 | $12,141 | $2,250 | $9,891 |
| 2013 | $1,734 | $12,141 | $2,250 | $9,891 |
Source: Public Records
Map
Nearby Homes
- 9035 S Oglesby Ave
- 2412 E 91st St
- 9039 S Phillips Ave
- 9043 S Luella Ave
- 9114 S Luella Ave
- 2149 E 90th St
- 2134 E 91st St
- 9207 S Paxton Ave
- 9156 S Colfax Ave
- 2620 E 91st St
- 9141 S Colfax Ave
- 2608 E 92nd St
- 9132 S Saginaw Ave
- 8757 S Paxton Ave
- 9129 S Chappel Ave
- 8737 S Essex Ave
- 9231 S Merrill Ave
- 8755 S Merrill Ave
- 8743 S Kingston Ave
- 9134 S Marquette Ave
- 9012 S Oglesby Ave
- 9006 S Oglesby Ave
- 9016 S Oglesby Ave
- 9004 S Oglesby Ave
- 9018 S Oglesby Ave
- 9000 S Oglesby Ave
- 9022 S Oglesby Ave
- 9011 S Crandon Ave
- 9011 S Crandon Ave
- 9007 S Crandon Ave
- 9024 S Oglesby Ave
- 9005 S Crandon Ave
- 9001 S Crandon Ave
- 9021 S Crandon Ave
- 9028 S Oglesby Ave
- 8958 S Oglesby Ave
- 9011 S Oglesby Ave
- 9015 S Oglesby Ave
- 9007 S Oglesby Ave