Estimated Value: $183,000 - $247,000
3
Beds
2
Baths
1,260
Sq Ft
$164/Sq Ft
Est. Value
About This Home
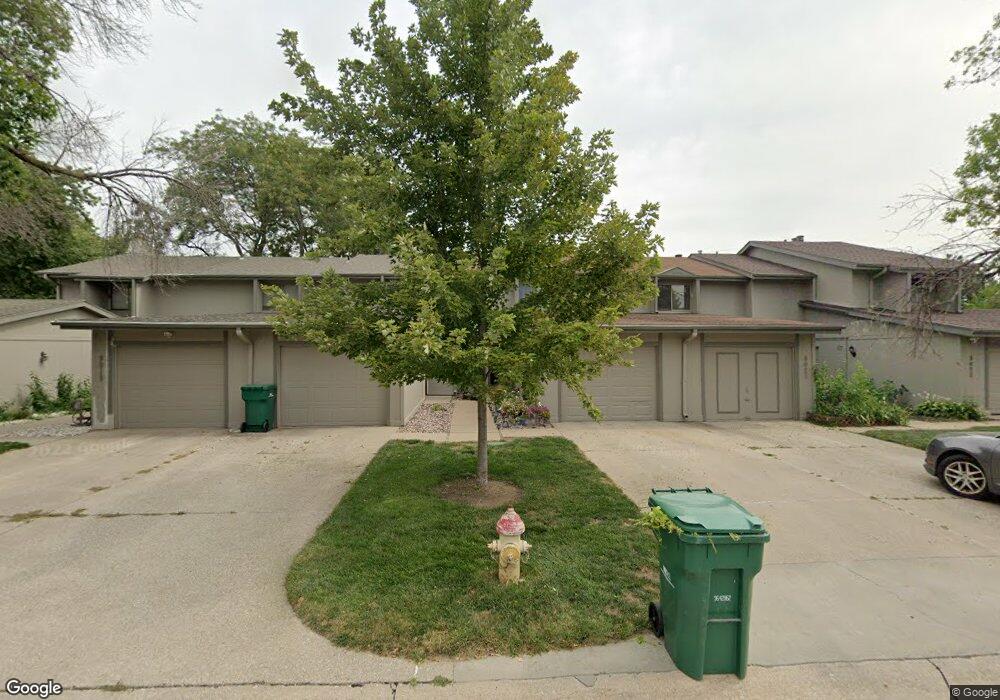
This home is located at 9019 David Cir, Omaha, NE 68138 and is currently estimated at $207,205, approximately $164 per square foot. 9019 David Cir is a home located in Sarpy County with nearby schools including Millard South High School, Norris Elementary School, and Millard Central Middle School.
Ownership History
Date
Name
Owned For
Owner Type
Purchase Details
Closed on
Jul 9, 2013
Sold by
Bratcher Ronald C and Bratcher Sherry A
Bought by
Bratcher Ronald C and Bratcher Sherry A
Current Estimated Value
Purchase Details
Closed on
Sep 24, 2010
Sold by
Fenton Donald
Bought by
Fenton Donald and Bratcher Sherry A
Home Financials for this Owner
Home Financials are based on the most recent Mortgage that was taken out on this home.
Original Mortgage
$71,176
Outstanding Balance
$46,832
Interest Rate
4.37%
Mortgage Type
FHA
Estimated Equity
$160,373
Purchase Details
Closed on
Sep 30, 2002
Sold by
Sigma Investments Inc
Bought by
Fenton Donald
Home Financials for this Owner
Home Financials are based on the most recent Mortgage that was taken out on this home.
Original Mortgage
$75,450
Interest Rate
6.2%
Mortgage Type
VA
Purchase Details
Closed on
Aug 2, 2002
Sold by
King Sherry A and Countrywide Home Loans Inc
Bought by
Sigma Investments Inc
Home Financials for this Owner
Home Financials are based on the most recent Mortgage that was taken out on this home.
Original Mortgage
$75,450
Interest Rate
6.2%
Mortgage Type
VA
Create a Home Valuation Report for This Property
The Home Valuation Report is an in-depth analysis detailing your home's value as well as a comparison with similar homes in the area
Home Values in the Area
Average Home Value in this Area
Purchase History
| Date | Buyer | Sale Price | Title Company |
|---|---|---|---|
| Bratcher Ronald C | -- | Dri Title & Escrow | |
| Fenton Donald | -- | Dri Title & Escrow | |
| Fenton Donald | $74,000 | -- | |
| Sigma Investments Inc | $43,000 | -- |
Source: Public Records
Mortgage History
| Date | Status | Borrower | Loan Amount |
|---|---|---|---|
| Open | Fenton Donald | $71,176 | |
| Closed | Fenton Donald | $75,450 |
Source: Public Records
Tax History
| Year | Tax Paid | Tax Assessment Tax Assessment Total Assessment is a certain percentage of the fair market value that is determined by local assessors to be the total taxable value of land and additions on the property. | Land | Improvement |
|---|---|---|---|---|
| 2025 | $2,818 | $164,195 | $24,000 | $140,195 |
| 2024 | $2,696 | $152,197 | $24,000 | $128,197 |
| 2023 | $2,696 | $125,621 | $22,000 | $103,621 |
| 2022 | $2,747 | $120,435 | $20,000 | $100,435 |
| 2021 | $2,569 | $111,369 | $20,000 | $91,369 |
| 2020 | $2,565 | $109,332 | $20,000 | $89,332 |
| 2019 | $2,376 | $101,091 | $16,000 | $85,091 |
| 2018 | $2,250 | $94,036 | $16,000 | $78,036 |
| 2017 | $2,011 | $85,232 | $16,000 | $69,232 |
| 2016 | $1,939 | $81,704 | $16,000 | $65,704 |
| 2015 | $1,895 | $79,409 | $16,000 | $63,409 |
| 2014 | $1,854 | $77,492 | $16,000 | $61,492 |
| 2012 | -- | $78,960 | $16,000 | $62,960 |
Source: Public Records
Map
Nearby Homes
- Lot 84 Granite Creek E
- 8406 S 142nd Ave
- 13580 Chandler St
- 13303 Chandler Ct
- 7320 S 140th Ave
- 12505 Pheasant Run Cir
- 7215 S 137th Ave
- 12359 Elk Ridge Cir
- 12351 Elk Ridge Cir
- 15225 Robin Dr
- 7503 S 147th St
- 13526 Gertrude St
- 14509 Willow Creek Dr
- 15240 Robin Dr
- 9715 S 123rd Ave
- 10106 S 123rd Ave
- 14615 Edna St
- 10602 S 126th Ct
- 13985 Polk St
- 12411 Osprey Ln
- 9017 David Cir
- 9021 David Cir
- 9015 David Cir
- 9023 David Cir
- 9013 David Cir
- 9013 David Cir
- 9009 David Cr
- 9009 David Cir
- 9025 David Cir
- 9027 David Cir
- 9007 David Cir
- 9029 David Cir
- 9029 David Cr
- 9031 David Cir
- 9005 David Cir
- 9033 David Cir
- 9003 David Cir
- 9035 David Cir
- 9001 David Cir
- 13811 Meadow Ridge Rd
Your Personal Tour Guide
Ask me questions while you tour the home.