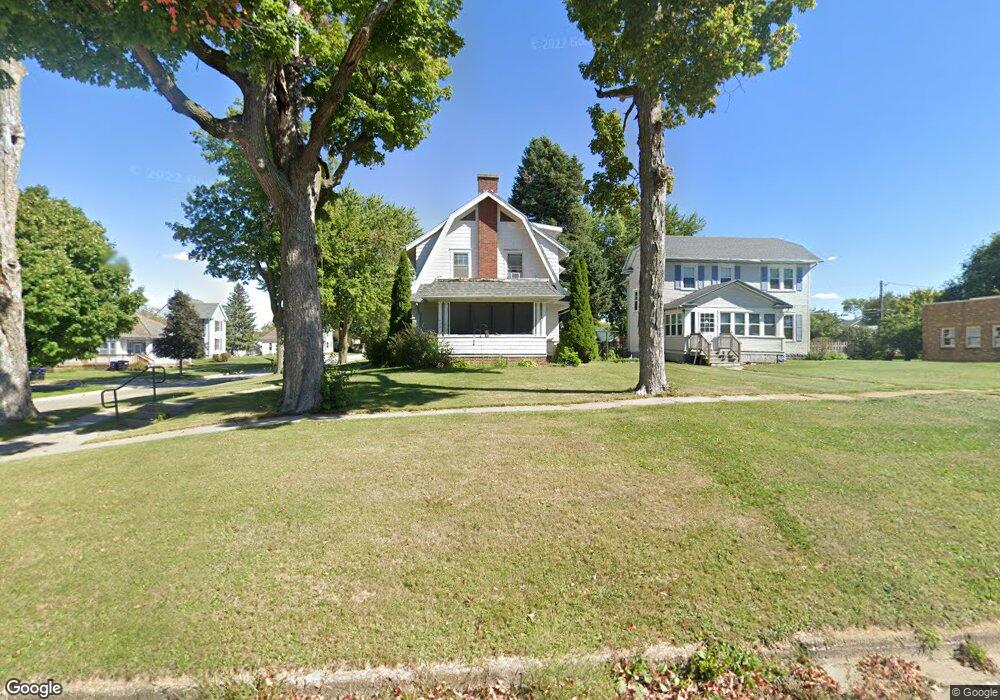
902 2nd Ave Vinton, IA 52349
Estimated Value: $146,874 - $188,000
4
Beds
4
Baths
1,680
Sq Ft
$97/Sq Ft
Est. Value
About This Home
This home is located at 902 2nd Ave, Vinton, IA 52349 and is currently estimated at $163,469, approximately $97 per square foot. 902 2nd Ave is a home located in Benton County with nearby schools including Tilford Elementary School, Vinton-Shellsburg Middle School, and Vinton-Shellsburg High School.
Ownership History
Date
Name
Owned For
Owner Type
Purchase Details
Closed on
May 23, 2010
Sold by
Schooley Michael W and Coots-Schooley Lisa G
Bought by
Whelan Robert M
Current Estimated Value
Home Financials for this Owner
Home Financials are based on the most recent Mortgage that was taken out on this home.
Original Mortgage
$104,220
Interest Rate
4.74%
Mortgage Type
FHA
Create a Home Valuation Report for This Property
The Home Valuation Report is an in-depth analysis detailing your home's value as well as a comparison with similar homes in the area
Home Values in the Area
Average Home Value in this Area
Purchase History
| Date | Buyer | Sale Price | Title Company |
|---|---|---|---|
| Whelan Robert M | $108,000 | None Available |
Source: Public Records
Mortgage History
| Date | Status | Borrower | Loan Amount |
|---|---|---|---|
| Previous Owner | Whelan Robert M | $104,220 |
Source: Public Records
Tax History
| Year | Tax Paid | Tax Assessment Tax Assessment Total Assessment is a certain percentage of the fair market value that is determined by local assessors to be the total taxable value of land and additions on the property. | Land | Improvement |
|---|---|---|---|---|
| 2025 | $2,224 | $141,900 | $16,300 | $125,600 |
| 2024 | $2,224 | $128,900 | $16,300 | $112,600 |
| 2023 | $2,054 | $128,900 | $16,300 | $112,600 |
| 2022 | $2,106 | $104,300 | $13,100 | $91,200 |
| 2021 | $2,106 | $104,300 | $13,100 | $91,200 |
| 2020 | $1,770 | $90,600 | $15,000 | $75,600 |
| 2019 | $1,870 | $90,600 | $15,000 | $75,600 |
| 2018 | $1,812 | $93,800 | $14,700 | $79,100 |
| 2017 | $1,734 | $93,800 | $14,700 | $79,100 |
| 2016 | $1,702 | $87,600 | $13,700 | $73,900 |
| 2015 | $1,702 | $87,600 | $13,700 | $73,900 |
| 2014 | $1,882 | $95,700 | $0 | $0 |
Source: Public Records
Map
Nearby Homes
Your Personal Tour Guide
Ask me questions while you tour the home.