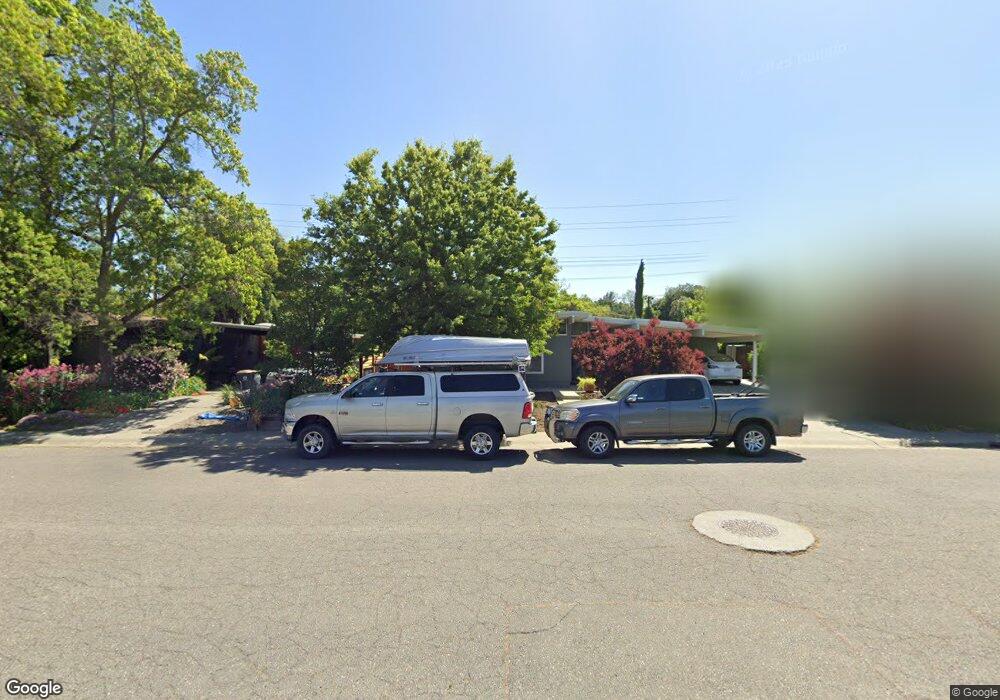
902 K St Davis, CA 95616
Central Davis NeighborhoodEstimated Value: $778,000 - $923,000
4
Beds
2
Baths
2,162
Sq Ft
$393/Sq Ft
Est. Value
About This Home
This home is located at 902 K St, Davis, CA 95616 and is currently estimated at $850,578, approximately $393 per square foot. 902 K St is a home located in Yolo County with nearby schools including North Davis Elementary School, Oliver Wendell Holmes Junior High School, and Davis Senior High School.
Ownership History
Date
Name
Owned For
Owner Type
Purchase Details
Closed on
Apr 27, 2021
Sold by
Schwab Torene and Schwab Paul
Bought by
Schwab Paul and Schwab Torene
Current Estimated Value
Purchase Details
Closed on
Jun 6, 2001
Sold by
Schwab Paul and Schwab Torene
Bought by
Schwab Paul and Schwab Torene
Home Financials for this Owner
Home Financials are based on the most recent Mortgage that was taken out on this home.
Original Mortgage
$264,000
Outstanding Balance
$100,563
Interest Rate
7.14%
Mortgage Type
Stand Alone First
Estimated Equity
$750,015
Purchase Details
Closed on
Oct 24, 1997
Sold by
Cory Leon & Sara Tr
Bought by
Schwab Paul and Schwab Torene
Home Financials for this Owner
Home Financials are based on the most recent Mortgage that was taken out on this home.
Original Mortgage
$126,400
Interest Rate
7.36%
Create a Home Valuation Report for This Property
The Home Valuation Report is an in-depth analysis detailing your home's value as well as a comparison with similar homes in the area
Home Values in the Area
Average Home Value in this Area
Purchase History
| Date | Buyer | Sale Price | Title Company |
|---|---|---|---|
| Schwab Paul | -- | None Available | |
| Schwab Paul | -- | First American Title Ins Co | |
| Schwab Paul | $158,000 | Placer Title Company |
Source: Public Records
Mortgage History
| Date | Status | Borrower | Loan Amount |
|---|---|---|---|
| Open | Schwab Paul | $264,000 | |
| Closed | Schwab Paul | $126,400 |
Source: Public Records
Tax History
| Year | Tax Paid | Tax Assessment Tax Assessment Total Assessment is a certain percentage of the fair market value that is determined by local assessors to be the total taxable value of land and additions on the property. | Land | Improvement |
|---|---|---|---|---|
| 2025 | $4,929 | $327,929 | $103,775 | $224,154 |
| 2023 | $4,929 | $315,197 | $99,747 | $215,450 |
| 2022 | $4,707 | $309,018 | $97,792 | $211,226 |
| 2021 | $4,583 | $302,960 | $95,875 | $207,085 |
| 2020 | $4,503 | $299,854 | $94,892 | $204,962 |
| 2019 | $4,227 | $293,976 | $93,032 | $200,944 |
| 2018 | $3,952 | $288,212 | $91,208 | $197,004 |
| 2017 | $3,864 | $282,562 | $89,420 | $193,142 |
| 2016 | $3,715 | $277,022 | $87,667 | $189,355 |
| 2015 | $3,588 | $272,862 | $86,351 | $186,511 |
| 2014 | $3,588 | $267,518 | $84,660 | $182,858 |
Source: Public Records
Map
Nearby Homes
- 1306 Drexel Dr
- 739 M St
- 1224 Spruce Ln
- 601 J St
- 615 11th St
- 646 F St
- 425 J St
- 704 6th St
- 1411 Madrone Ln
- 717 D St
- 405 7th St
- 2011 Regis Dr
- 1000 Berryessa Ln Unit 333
- 1000 Berryessa Ln Unit 232
- 1000 Berryessa Ln Unit 314
- 1000 Berryessa Ln Unit 211
- 1053 Caspian Pink Terrace
- 1018 Ovejas Ave
- 1661 Spring St Unit 443
- 1661 Spring St Unit 424
Your Personal Tour Guide
Ask me questions while you tour the home.