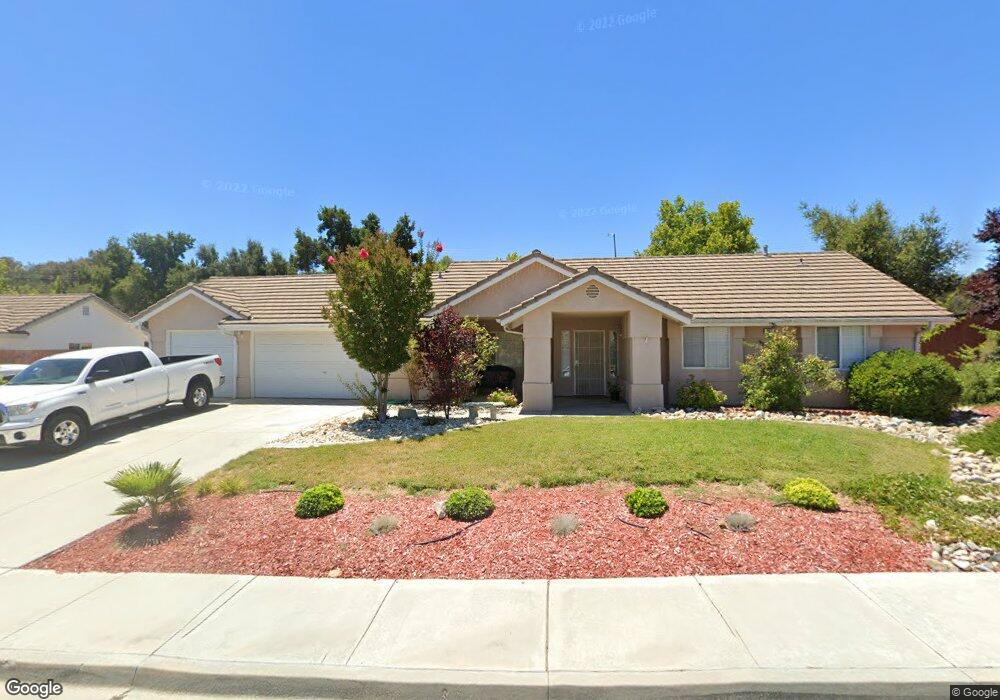
902 Sleepy Hollow Rd Paso Robles, CA 93446
Estimated Value: $650,000 - $791,000
3
Beds
2
Baths
1,207
Sq Ft
$580/Sq Ft
Est. Value
About This Home
This home is located at 902 Sleepy Hollow Rd, Paso Robles, CA 93446 and is currently estimated at $700,165, approximately $580 per square foot. 902 Sleepy Hollow Rd is a home located in San Luis Obispo County with nearby schools including Pat Butler Elementary School, George H. Flamson Middle School, and Paso Robles High School.
Ownership History
Date
Name
Owned For
Owner Type
Purchase Details
Closed on
Apr 15, 2009
Sold by
Downing Kathe Ann
Bought by
Carnell Teresa
Current Estimated Value
Home Financials for this Owner
Home Financials are based on the most recent Mortgage that was taken out on this home.
Original Mortgage
$324,022
Outstanding Balance
$202,292
Interest Rate
4.71%
Mortgage Type
FHA
Estimated Equity
$497,873
Purchase Details
Closed on
May 7, 2004
Sold by
Downing T W
Bought by
Downing T W and Downing Kathe Ann
Home Financials for this Owner
Home Financials are based on the most recent Mortgage that was taken out on this home.
Original Mortgage
$172,500
Interest Rate
5.5%
Mortgage Type
New Conventional
Purchase Details
Closed on
Apr 22, 1996
Sold by
Huneycutt Harry C
Bought by
Downing T W
Home Financials for this Owner
Home Financials are based on the most recent Mortgage that was taken out on this home.
Original Mortgage
$103,200
Interest Rate
7.84%
Mortgage Type
Balloon
Create a Home Valuation Report for This Property
The Home Valuation Report is an in-depth analysis detailing your home's value as well as a comparison with similar homes in the area
Home Values in the Area
Average Home Value in this Area
Purchase History
| Date | Buyer | Sale Price | Title Company |
|---|---|---|---|
| Carnell Teresa | $330,000 | Fidelity National Title Co | |
| Downing T W | -- | Fidelity Title Company | |
| Downing T W | -- | Fidelity Title Company | |
| Downing T W | $129,000 | First American Title Ins Co |
Source: Public Records
Mortgage History
| Date | Status | Borrower | Loan Amount |
|---|---|---|---|
| Open | Carnell Teresa | $324,022 | |
| Previous Owner | Downing T W | $172,500 | |
| Previous Owner | Downing T W | $103,200 |
Source: Public Records
Tax History Compared to Growth
Tax History
| Year | Tax Paid | Tax Assessment Tax Assessment Total Assessment is a certain percentage of the fair market value that is determined by local assessors to be the total taxable value of land and additions on the property. | Land | Improvement |
|---|---|---|---|---|
| 2025 | $4,991 | $424,941 | $206,030 | $218,911 |
| 2024 | $4,915 | $416,610 | $201,991 | $214,619 |
| 2023 | $4,915 | $408,442 | $198,031 | $210,411 |
| 2022 | $4,797 | $400,435 | $194,149 | $206,286 |
| 2021 | $4,671 | $392,585 | $190,343 | $202,242 |
| 2020 | $4,605 | $388,561 | $188,392 | $200,169 |
| 2019 | $4,535 | $380,944 | $184,699 | $196,245 |
| 2018 | $4,476 | $373,476 | $181,078 | $192,398 |
| 2017 | $4,226 | $366,154 | $177,528 | $188,626 |
| 2016 | $4,148 | $358,976 | $174,048 | $184,928 |
| 2015 | $4,111 | $353,585 | $171,434 | $182,151 |
| 2014 | $3,976 | $346,659 | $168,076 | $178,583 |
Source: Public Records
Map
Nearby Homes
- 907 Saint Ann Dr
- 911 Saint Ann Dr
- 909 Palm Desert Ct
- 1685 Arbolado Rd
- 919 Torrey Pines Dr
- 1050 Sleepy Hollow Rd
- 128 Flag Way Unit A
- 789 Oxen St
- 1337 Stoney Creek Rd
- 17 Green Ct
- 204 Nighthawk Dr
- 1716 Wade Dr
- 924 Moran Ct
- 915 Moran Ct
- 912 Wade Dr
- 1185 Beaver Creek Ln
- 1951 Tulipwood Dr
- 1010 Spanish Camp Rd
- 1880 Fire Rock Loop
- 1410 Fire Rock Loop
- 904 Sleepy Hollow Rd
- 901 Sleepy Hollow Rd
- 903 Sleepy Hollow Rd
- 2105 Rambouillet Rd
- 2103 Rambouillet Rd
- 906 Sleepy Hollow Rd
- 2005 Crystal Canyon Ct
- 2101 Rambouillet Rd
- 2003 Crystal Canyon Ct
- 812 Saint Andrews Cir
- 814 Saint Andrews Cir
- 908 Sleepy Hollow Rd
- 808 Saint Andrews Cir
- 2001 Crystal Canyon Ct
- 2006 Crystal Canyon Ct
- 2004 Crystal Canyon Ct
- 816 Saint Andrews Cir
- 1730 Arbolado Rd
- 2002 Crystal Canyon Ct
- 1652 Arbolado Rd