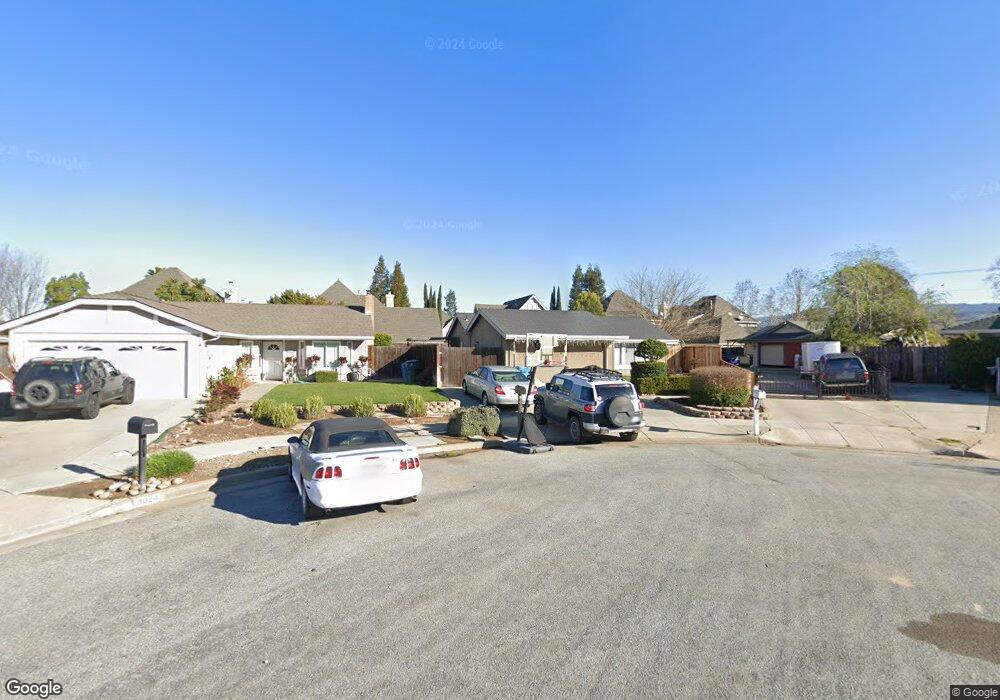
9020 Freeman Ct Gilroy, CA 95020
Las Animas NeighborhoodEstimated Value: $792,390 - $905,000
4
Beds
2
Baths
1,157
Sq Ft
$723/Sq Ft
Est. Value
About This Home
This home is located at 9020 Freeman Ct, Gilroy, CA 95020 and is currently estimated at $836,348, approximately $722 per square foot. 9020 Freeman Ct is a home located in Santa Clara County with nearby schools including South Valley Middle School, Solorsano Middle School, and Christopher High School.
Ownership History
Date
Name
Owned For
Owner Type
Purchase Details
Closed on
Mar 25, 2003
Sold by
Sicard Troy Anthony and Flores Cheryl L
Bought by
Sicard Troy and Flores Cheryl
Current Estimated Value
Home Financials for this Owner
Home Financials are based on the most recent Mortgage that was taken out on this home.
Original Mortgage
$255,000
Outstanding Balance
$108,904
Interest Rate
5.79%
Mortgage Type
Purchase Money Mortgage
Estimated Equity
$727,444
Purchase Details
Closed on
Sep 27, 2001
Sold by
Sicard Troy Anthony
Bought by
Sicard Troy Anthony and Flores Cheryl L
Home Financials for this Owner
Home Financials are based on the most recent Mortgage that was taken out on this home.
Original Mortgage
$255,000
Interest Rate
6.9%
Purchase Details
Closed on
Jun 3, 1994
Sold by
Murray Fornie L and Taugher Kathleen S
Bought by
Sicard Troy Anthony
Home Financials for this Owner
Home Financials are based on the most recent Mortgage that was taken out on this home.
Original Mortgage
$180,438
Interest Rate
8.35%
Mortgage Type
Assumption
Create a Home Valuation Report for This Property
The Home Valuation Report is an in-depth analysis detailing your home's value as well as a comparison with similar homes in the area
Home Values in the Area
Average Home Value in this Area
Purchase History
| Date | Buyer | Sale Price | Title Company |
|---|---|---|---|
| Sicard Troy | -- | Alliance Title Company | |
| Sicard Troy Anthony | $127,500 | Alliance Title Company | |
| Sicard Troy Anthony | $177,000 | North American Title Co Inc |
Source: Public Records
Mortgage History
| Date | Status | Borrower | Loan Amount |
|---|---|---|---|
| Open | Sicard Troy | $255,000 | |
| Closed | Sicard Troy Anthony | $255,000 | |
| Closed | Sicard Troy Anthony | $180,438 |
Source: Public Records
Tax History
| Year | Tax Paid | Tax Assessment Tax Assessment Total Assessment is a certain percentage of the fair market value that is determined by local assessors to be the total taxable value of land and additions on the property. | Land | Improvement |
|---|---|---|---|---|
| 2025 | $3,747 | $300,813 | $101,961 | $198,852 |
| 2024 | $3,747 | $294,915 | $99,962 | $194,953 |
| 2023 | $3,724 | $289,133 | $98,002 | $191,131 |
| 2022 | $3,662 | $283,465 | $96,081 | $187,384 |
| 2021 | $3,644 | $277,908 | $94,198 | $183,710 |
| 2020 | $3,813 | $275,060 | $93,233 | $181,827 |
| 2019 | $3,572 | $269,667 | $91,405 | $178,262 |
| 2018 | $3,524 | $264,380 | $89,613 | $174,767 |
| 2017 | $3,406 | $259,197 | $87,856 | $171,341 |
| 2016 | $3,332 | $254,116 | $86,134 | $167,982 |
| 2015 | $3,146 | $250,300 | $84,841 | $165,459 |
| 2014 | $3,253 | $245,398 | $83,180 | $162,218 |
Source: Public Records
Map
Nearby Homes
- 119 Farrell Ave
- 103 Farrell Ave
- 111 Farrell Ave
- 170 Sturla Way
- 401 Arnold Dr
- 0 Magic Springs Dr Unit ML82028522
- 0 Dorrance Rd Unit ML82002071
- 0000 Hecker Pass
- 700 Las Animas Ave
- 760 Welburn Ave
- 946 Martiri Ct
- 626 Broadway
- 620 Broadway
- 622 Broadway
- 9400 Benbow Dr
- 8282 Murray Ave Unit 99
- 8282 Murray Ave Unit 65
- 803 Sunrise Dr
- 730 Lepa Ct
- 0A Buena Vista Ave
- 9024 Freeman Ct
- 9014 Freeman Ct
- 30 Canterbury Place
- 40 Canterbury Place
- 9010 Freeman Ct
- 9030 Freeman Ct
- 20 Canterbury Place
- 50 Canterbury Place
- 9004 Freeman Ct
- 10 Canterbury Place
- 9034 Freeman Ct
- 9040 Freeman Ct
- 9000 Freeman Ct
- 9044 Freeman Ct
- 60 Canterbury Place
- 9050 Freeman Ct
- 35 Canterbury Place
- 45 Canterbury Place
- 9054 Freeman Ct
- 25 Canterbury Place
Your Personal Tour Guide
Ask me questions while you tour the home.