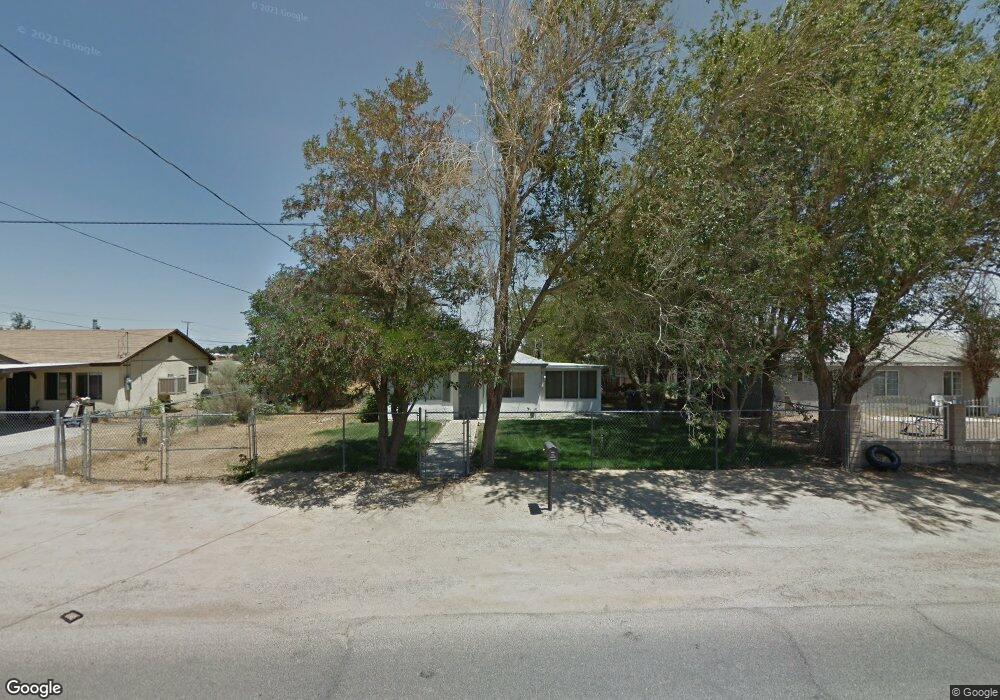
9021 E Avenue r8 Littlerock, CA 93543
Estimated Value: $315,159 - $493,000
3
Beds
1
Bath
858
Sq Ft
$489/Sq Ft
Est. Value
About This Home
This home is located at 9021 E Avenue r8, Littlerock, CA 93543 and is currently estimated at $419,790, approximately $489 per square foot. 9021 E Avenue r8 is a home located in Los Angeles County with nearby schools including Daisy Gibson Elementary School, Keppel Academy, and Littlerock High School.
Ownership History
Date
Name
Owned For
Owner Type
Purchase Details
Closed on
May 24, 2018
Sold by
Isom Charies M
Bought by
Isom Bonnie F
Current Estimated Value
Home Financials for this Owner
Home Financials are based on the most recent Mortgage that was taken out on this home.
Original Mortgage
$116,000
Outstanding Balance
$100,109
Interest Rate
4.5%
Mortgage Type
New Conventional
Estimated Equity
$319,681
Purchase Details
Closed on
May 4, 2018
Sold by
Isom Bonnie Faye
Bought by
Isom Bonnie Faye and Collier Elmore Travis
Home Financials for this Owner
Home Financials are based on the most recent Mortgage that was taken out on this home.
Original Mortgage
$116,000
Outstanding Balance
$100,109
Interest Rate
4.5%
Mortgage Type
New Conventional
Estimated Equity
$319,681
Purchase Details
Closed on
Mar 26, 2000
Sold by
Collier Florence
Bought by
Collier Florence and Florence Moore Collier Family Living Tr
Create a Home Valuation Report for This Property
The Home Valuation Report is an in-depth analysis detailing your home's value as well as a comparison with similar homes in the area
Home Values in the Area
Average Home Value in this Area
Purchase History
| Date | Buyer | Sale Price | Title Company |
|---|---|---|---|
| Isom Bonnie F | -- | First American Title Company | |
| Collier Elmore Travis | -- | First American Title Company | |
| Isom Bonnie Faye | -- | None Available | |
| Isom Bonnie Faye | -- | None Available | |
| Collier Florence | -- | -- |
Source: Public Records
Mortgage History
| Date | Status | Borrower | Loan Amount |
|---|---|---|---|
| Open | Isom Bonnie F | $116,000 |
Source: Public Records
Tax History Compared to Growth
Tax History
| Year | Tax Paid | Tax Assessment Tax Assessment Total Assessment is a certain percentage of the fair market value that is determined by local assessors to be the total taxable value of land and additions on the property. | Land | Improvement |
|---|---|---|---|---|
| 2025 | $2,041 | $166,107 | $41,138 | $124,969 |
| 2024 | $2,041 | $162,851 | $40,332 | $122,519 |
| 2023 | $1,998 | $159,659 | $39,542 | $120,117 |
| 2022 | $1,963 | $156,529 | $38,767 | $117,762 |
| 2021 | $1,926 | $153,460 | $38,007 | $115,453 |
| 2019 | $2,303 | $186,660 | $46,920 | $139,740 |
| 2018 | $372 | $23,748 | $2,129 | $21,619 |
| 2016 | $341 | $22,829 | $2,048 | $20,781 |
| 2015 | $336 | $22,487 | $2,018 | $20,469 |
| 2014 | $345 | $22,048 | $1,979 | $20,069 |
Source: Public Records
Map
Nearby Homes
- 9249 E Avenue r10
- 9069 E Avenue r14
- 9069 E Avenue R 14
- 0 Ave R14 Vic 92nd Ste Unit IV24250455
- 0 Ave R14 Vic 92nd Ste Unit 24009183
- 0 Vac Corner Ave S 90th Ste
- 9604 E Avenue r12
- 136 Th. Str& East Ave S
- 118 East Ave S
- 10516 East Ave S
- 90 90th St E & Kanow (Ave S-4)
- 9237 E Avenue q12
- 10 East Ave S
- 9642 E Avenue R 14
- 9642 E Avenue r14
- 0 Vac Avenue S 87th Ste
- 0 Cor Ave R8 100th Ste Unit 25005146
- 0 E Avenue s2
- 0 E 90th St Unit HD24243656
- 1000 100th St E
- 9029 E Avenue r8
- 37610 90th St E
- 9014 E Avenue r8
- 9038 E Avenue r8
- 9006 E Avenue r8
- 90ste Vic Ave R-8 Ave Unit Ste Vic
- 37542 90th St E
- 37650 90th St E
- 9044 E Avenue r8
- 0 Spooner Avenue Vic Ave Unit R8 18004488
- 0 Spooner Avenue Vic Ave Unit R8 18006398
- 37662 90th St E
- 37539 90th St E
- 9108 E Avenue r8
- 37704 90th St E
- 37705 Vac 90th Ste Vic Avenue R8
- 9007 E Avenue r10
- 9057 E Avenue r10
- 9037 E Avenue r10
- 0 90th St & Ave R6 Unit 15005504