


4
Beds
2.5
Baths
2,000
Sq Ft
1,307
Sq Ft Lot
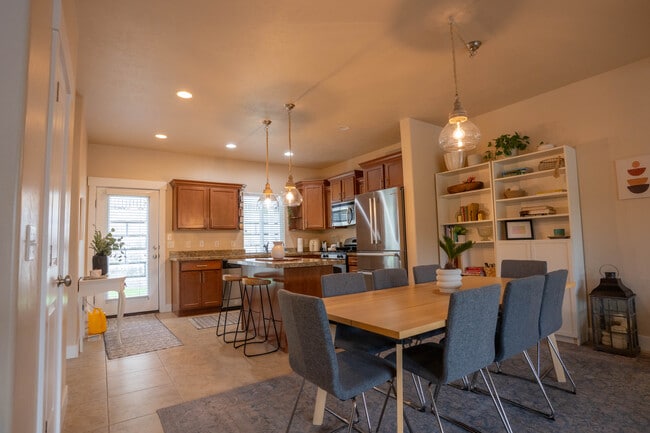
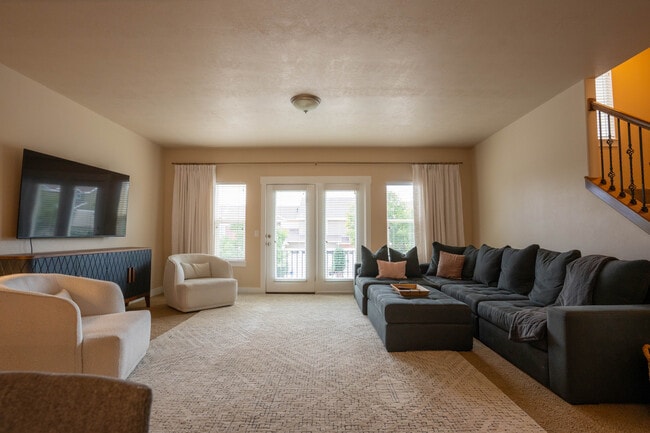
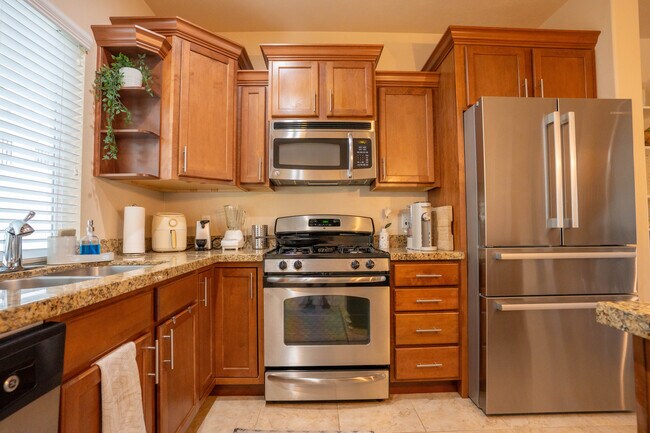
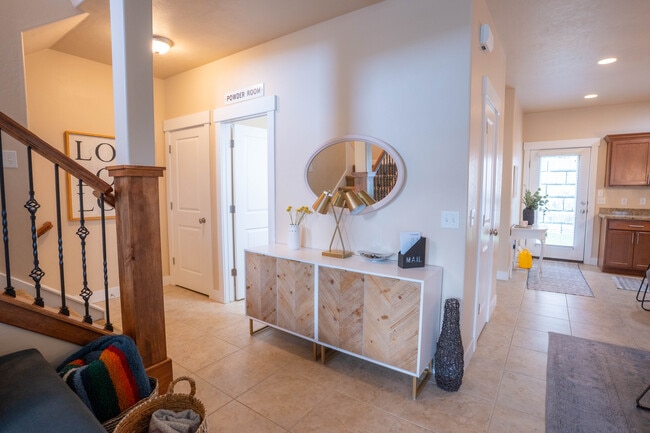
About This Home
***FURNISHED****Discover the perfect blend of comfort and convenience in this furnished pet-friendly townhome featuring three generous bedrooms, a dedicated office space, and 2.5 bathrooms. The extended two-car garage provides ample storage and comes equipped with workout equipment for your fitness needs including a peloton and treadmill. An additional pet deposit of $300 will be required as well as an additional $100/month pet fee.
Listing Provided By

Map
Property History
| Date | Event | Price | List to Sale | Price per Sq Ft |
|---|---|---|---|---|
| 11/28/2025 11/28/25 | Price Changed | $3,350 | -8.2% | $2 / Sq Ft |
| 10/31/2025 10/31/25 | Price Changed | $3,650 | -3.9% | $2 / Sq Ft |
| 09/15/2025 09/15/25 | For Rent | $3,800 | -- | -- |
Nearby Homes
- 8935 Quarry Stone Way
- 9083 Enchanted Oak Ln
- 9144 S Peach Blossom Dr
- 9092 Enchanted Oak Ln
- 807 E Whisper Cove Rd
- 1368 Silvercrest Dr
- 1393 E Galaxie Dr
- 8731 Gladiator Way
- 1100 E Webster Dr
- 9439 S Meckailee Cove
- 783 E Newfield Dr Unit 146
- 8657 S 910 E
- 9464 S Meckailee Cove
- 775 E Autumn Field Dr
- 1430 E 8685 S
- 8797 Green Way Unit 3
- 1492 E Sandy Hills Dr
- 8722 S Oakwood Park Cir Unit 8722
- 1616 Waters Ln
- 8729 S Leafwood Ln
- 903 - 9000 E South S
- 845 E 9000 S
- 807 Whisper Cove Rd
- 1191 E 8600 S Unit Apartment B
- 1404 E 8685 S
- 9164 Coppercreek Cir Unit ID1249865P
- 797 Newfield Dr
- 9548 S 1210 E
- 8705 S Altair Dr Unit 8705
- 916 E 8475 S Unit 2
- 9206 S 700 E
- 730 E Village Way
- 8379 Sycamore Tree Cove Unit Private Bed and Bath
- 1212 E 8280 S Unit ID1249902P
- 676 E Howard Dr Unit Basement Apartment
- 8240 S Marion View Cir Unit 3 - Upstairs North Bedroom
- 8176 S 1300 E
- 1344 E 8125 S
- 9949 Sego Lily Dr Unit ID1253730P
- 440 E 8490 S