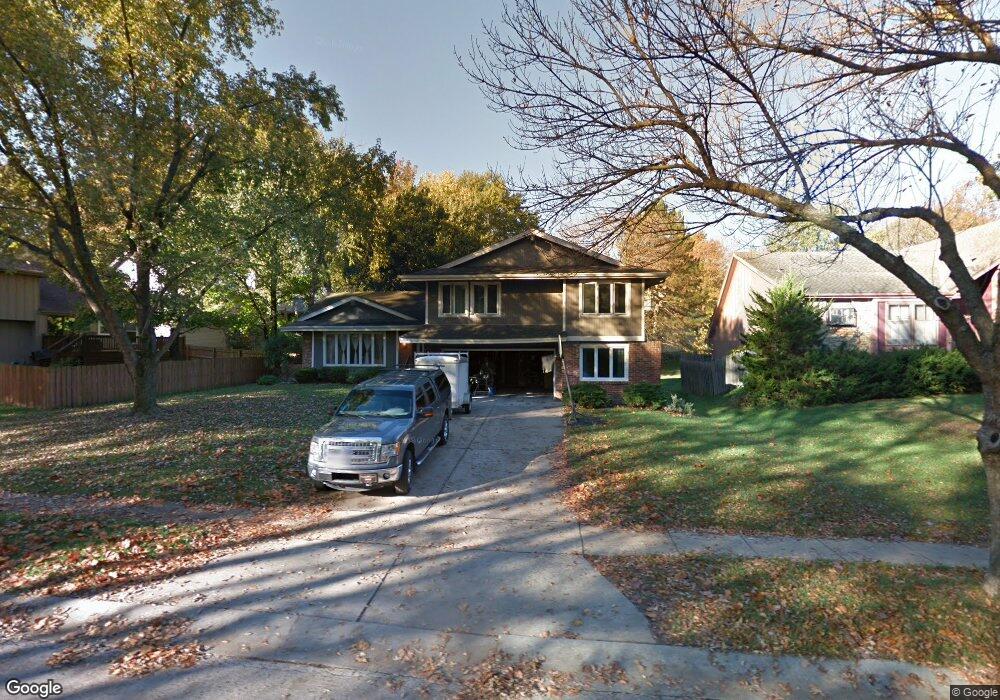
9024 Acuff Ln Lenexa, KS 66215
Estimated Value: $385,975 - $422,000
4
Beds
3
Baths
1,717
Sq Ft
$237/Sq Ft
Est. Value
About This Home
This home is located at 9024 Acuff Ln, Lenexa, KS 66215 and is currently estimated at $407,744, approximately $237 per square foot. 9024 Acuff Ln is a home located in Johnson County with nearby schools including Sunflower Elementary School, Westridge Middle School, and Shawnee Mission West High School.
Ownership History
Date
Name
Owned For
Owner Type
Purchase Details
Closed on
Sep 13, 2010
Sold by
Smith Geoffrey C and Smith Marcia L
Bought by
Smith Geoffrey C and Smith Marcia L
Current Estimated Value
Home Financials for this Owner
Home Financials are based on the most recent Mortgage that was taken out on this home.
Original Mortgage
$106,100
Outstanding Balance
$69,208
Interest Rate
4.51%
Mortgage Type
New Conventional
Estimated Equity
$338,536
Purchase Details
Closed on
Jul 26, 2010
Sold by
Smith Geoffrey C and Smith Marcia L
Bought by
Smith Geoffrey C and Smith Marcia L
Home Financials for this Owner
Home Financials are based on the most recent Mortgage that was taken out on this home.
Original Mortgage
$106,100
Outstanding Balance
$69,208
Interest Rate
4.51%
Mortgage Type
New Conventional
Estimated Equity
$338,536
Purchase Details
Closed on
Mar 25, 2008
Sold by
Mcbride Thomas J and Mcbride Kirsten
Bought by
Young Daniel D and Young Christine M
Create a Home Valuation Report for This Property
The Home Valuation Report is an in-depth analysis detailing your home's value as well as a comparison with similar homes in the area
Home Values in the Area
Average Home Value in this Area
Purchase History
| Date | Buyer | Sale Price | Title Company |
|---|---|---|---|
| Smith Geoffrey C | -- | Chicago Title Ins Co | |
| Smith Geoffrey C | -- | None Available | |
| Young Daniel D | -- | Kansas City Title |
Source: Public Records
Mortgage History
| Date | Status | Borrower | Loan Amount |
|---|---|---|---|
| Open | Smith Geoffrey C | $106,100 |
Source: Public Records
Tax History
| Year | Tax Paid | Tax Assessment Tax Assessment Total Assessment is a certain percentage of the fair market value that is determined by local assessors to be the total taxable value of land and additions on the property. | Land | Improvement |
|---|---|---|---|---|
| 2025 | $4,544 | $41,584 | $9,016 | $32,568 |
| 2024 | $4,544 | $41,124 | $7,835 | $33,289 |
| 2023 | $4,233 | $37,594 | $7,465 | $30,129 |
| 2022 | $3,893 | $34,535 | $7,105 | $27,430 |
| 2021 | $3,717 | $31,246 | $6,768 | $24,478 |
| 2020 | $3,387 | $28,152 | $6,149 | $22,003 |
| 2019 | $3,225 | $26,772 | $5,351 | $21,421 |
| 2018 | $3,067 | $25,220 | $4,868 | $20,352 |
| 2017 | $3,040 | $24,231 | $4,429 | $19,802 |
| 2016 | $2,977 | $23,437 | $4,429 | $19,008 |
| 2015 | $2,791 | $22,103 | $4,429 | $17,674 |
| 2013 | -- | $20,229 | $4,429 | $15,800 |
Source: Public Records
Map
Nearby Homes
- 9029 Acuff Ln
- 14640 W 90th St
- 14900 W 91st Terrace
- 8645 Greenwood Ln
- 8914 Country Hill Ct
- 8740 Park St
- 9212 Constance St
- 15113 W 91st Place
- 15514 W 89th St
- 8362 Oakview Cir
- 8443 Alden St
- 8403 Swarner Dr
- 14828 W 83rd Place
- 13204 W 85th Ct
- 13212 W 84th St
- 8041 Acuff Ln
- 12908 W 84th St
- 12525 W 85th Terrace
- 8545 Westgate St
- 15318 W 80th Place
- 9020 Acuff Ln
- 14400 W 91st St
- 14406 W 91st St
- 14409 W 90th Terrace
- 14414 W 91st St
- 9025 Acuff Ln
- 14413 W 90th Terrace
- 9033 Acuff Ln
- 14418 W 91st St
- 9021 Acuff Ln
- 9037 Acuff Ln
- 14404 W 90th Terrace
- 14408 W 90th Terrace
- 14401 W 91st St
- 14417 W 90th Terrace
- 14412 W 90th Terrace
- 14405 W 91st St
- 9017 Acuff Ln
- 14504 W 91st St
- 9103 Acuff Ln
Your Personal Tour Guide
Ask me questions while you tour the home.