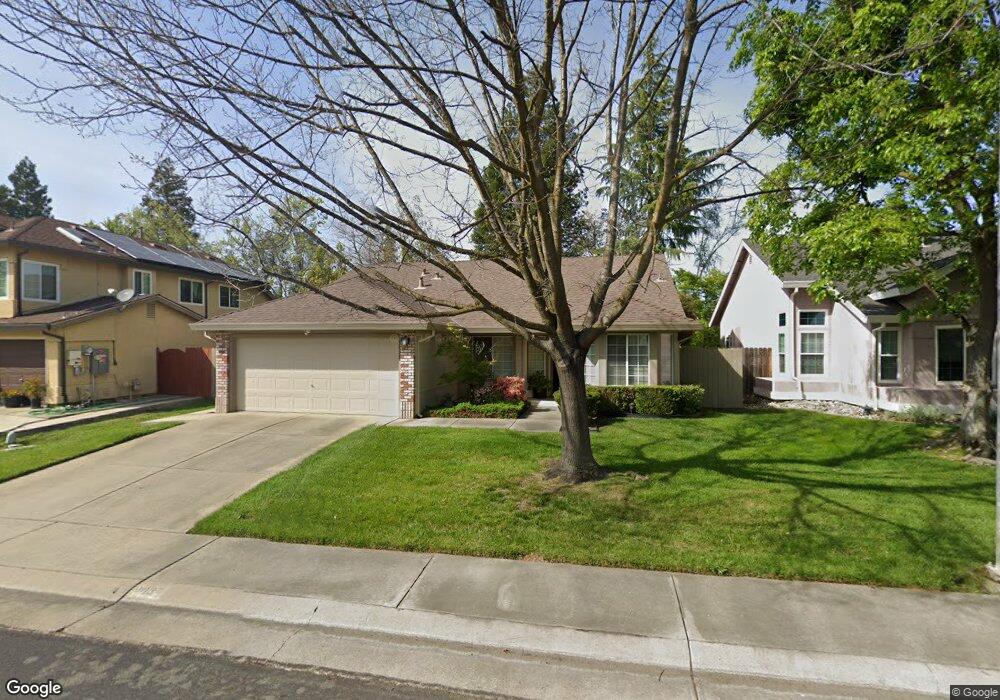
9037 Paso Robles Way Elk Grove, CA 95758
North West Elk Grove NeighborhoodEstimated Value: $467,000 - $517,000
3
Beds
2
Baths
1,343
Sq Ft
$366/Sq Ft
Est. Value
About This Home
This home is located at 9037 Paso Robles Way, Elk Grove, CA 95758 and is currently estimated at $491,793, approximately $366 per square foot. 9037 Paso Robles Way is a home located in Sacramento County with nearby schools including John Ehrhardt Elementary School, Harriet G. Eddy Middle School, and Laguna Creek High School.
Ownership History
Date
Name
Owned For
Owner Type
Purchase Details
Closed on
Nov 22, 2021
Sold by
Janey Deanna M and Deanna M Janey 2018 Revocable
Bought by
Janey Deanna M and Deanna M Janey 2018 Revocable
Current Estimated Value
Home Financials for this Owner
Home Financials are based on the most recent Mortgage that was taken out on this home.
Original Mortgage
$780,000
Outstanding Balance
$714,340
Interest Rate
3.1%
Estimated Equity
-$222,547
Purchase Details
Closed on
Nov 7, 2018
Sold by
Janey Deanna M
Bought by
Janey Deanna M
Home Financials for this Owner
Home Financials are based on the most recent Mortgage that was taken out on this home.
Interest Rate
4.83%
Create a Home Valuation Report for This Property
The Home Valuation Report is an in-depth analysis detailing your home's value as well as a comparison with similar homes in the area
Home Values in the Area
Average Home Value in this Area
Purchase History
| Date | Buyer | Sale Price | Title Company |
|---|---|---|---|
| Janey Deanna M | -- | North American Title Co Inc | |
| Janey Deanna M | -- | North American Title Co Inc | |
| Janey Deanna M | -- | -- |
Source: Public Records
Mortgage History
| Date | Status | Borrower | Loan Amount |
|---|---|---|---|
| Open | Janey Deanna M | $780,000 | |
| Closed | Janey Deanna M | $780,000 | |
| Closed | Janey Deanna M | -- |
Source: Public Records
Tax History Compared to Growth
Tax History
| Year | Tax Paid | Tax Assessment Tax Assessment Total Assessment is a certain percentage of the fair market value that is determined by local assessors to be the total taxable value of land and additions on the property. | Land | Improvement |
|---|---|---|---|---|
| 2025 | $2,911 | $239,490 | $106,086 | $133,404 |
| 2024 | $2,911 | $234,795 | $104,006 | $130,789 |
| 2023 | $2,828 | $230,192 | $101,967 | $128,225 |
| 2022 | $2,782 | $225,679 | $99,968 | $125,711 |
| 2021 | $2,721 | $221,255 | $98,008 | $123,247 |
| 2020 | $2,680 | $218,988 | $97,004 | $121,984 |
| 2019 | $2,627 | $214,695 | $95,102 | $119,593 |
| 2018 | $2,557 | $210,487 | $93,238 | $117,249 |
| 2017 | $2,505 | $206,360 | $91,410 | $114,950 |
| 2016 | $2,395 | $202,315 | $89,618 | $112,697 |
| 2015 | $2,346 | $199,277 | $88,272 | $111,005 |
| 2014 | $2,316 | $195,374 | $86,543 | $108,831 |
Source: Public Records
Map
Nearby Homes
- 6925 Risata Way
- 6009 Greybridge Ct
- 6465 Laguna Mirage Ln
- 0 Elliott Ranch Rd Unit 225131105
- 6348 Laguna Mirage Ln
- 6813 Paseo Del Sol Way
- 5501 Big Creek Way
- 5161 Saint Edwards Way
- 9105 Turnbull Ct
- 6024 Deepdale Way
- 6131 Jacinto Ave
- 6809 Harvest Oak Ct
- 7213 Tiant Way
- 5208 Misty Meadow Way
- 8939 Generations Ct
- Residence 2125 Plan at Tegan Estates
- Residence 1845 Plan at Tegan Estates
- Residence 1960 Plan at Tegan Estates
- Residence 1850 Plan at Tegan Estates
- 8741 Noble Fir Ln
- 9041 Paso Robles Way
- 9033 Paso Robles Way
- 8984 Meadowspring Dr
- 960 Paso Robles Way
- 8988 Meadowspring Dr
- 9045 Paso Robles Way
- 9029 Paso Robles Way
- 8980 Meadowspring Dr
- 9036 Paso Robles Way
- 9040 Paso Robles Way
- 9032 Paso Robles Way
- 8992 Meadowspring Dr
- 8976 Meadowspring Dr
- 9044 Paso Robles Way
- 9049 Paso Robles Way
- 9025 Paso Robles Way
- 9028 Paso Robles Way
- 8996 Meadowspring Dr
- 9048 Paso Robles Way
- 9024 Paso Robles Way