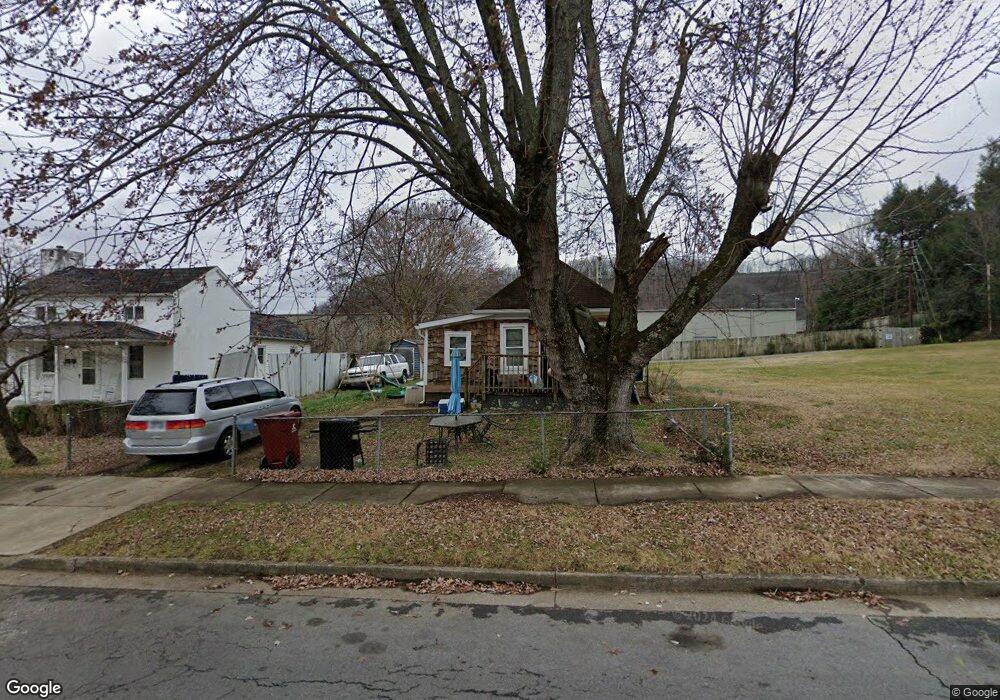
904 E Myrtle Ave Johnson City, TN 37601
Gump Addition-Carnegie NeighborhoodEstimated Value: $106,000 - $154,000
1
Bed
1
Bath
770
Sq Ft
$166/Sq Ft
Est. Value
About This Home
This home is located at 904 E Myrtle Ave, Johnson City, TN 37601 and is currently estimated at $127,738, approximately $165 per square foot. 904 E Myrtle Ave is a home located in Washington County with nearby schools including North Side Elementary School, Liberty Bell Middle School, and Indian Trail Middle School.
Ownership History
Date
Name
Owned For
Owner Type
Purchase Details
Closed on
Jan 20, 2025
Sold by
Whitson John P
Bought by
Whitson Jeremy and Whitson Andrea
Current Estimated Value
Purchase Details
Closed on
Oct 1, 2021
Sold by
Booth Pamela M
Bought by
Thomas Huichun and Thomas Samuel
Purchase Details
Closed on
Oct 22, 2019
Sold by
Whitson Elizabeth Ann
Bought by
Whitson John P
Purchase Details
Closed on
Mar 16, 2009
Sold by
Regions Bank
Bought by
Booth Pamela M
Purchase Details
Closed on
Dec 4, 2008
Sold by
Vega Raymond A
Bought by
Regions Bank
Purchase Details
Closed on
Nov 14, 2003
Sold by
Abel Christina L
Bought by
Vega Raymond A
Purchase Details
Closed on
Apr 10, 2003
Sold by
Swanner Ethel
Bought by
Abel Christina
Purchase Details
Closed on
Apr 4, 2003
Bought by
Abel Christina
Purchase Details
Closed on
Sep 10, 1999
Sold by
Mae Abel Harry and Mae Ethel
Bought by
Merrick Michael K
Create a Home Valuation Report for This Property
The Home Valuation Report is an in-depth analysis detailing your home's value as well as a comparison with similar homes in the area
Home Values in the Area
Average Home Value in this Area
Purchase History
| Date | Buyer | Sale Price | Title Company |
|---|---|---|---|
| Whitson Jeremy | -- | None Listed On Document | |
| Whitson Jeremy | -- | None Listed On Document | |
| Thomas Huichun | $55,000 | None Available | |
| Whitson John P | -- | None Available | |
| Booth Pamela M | $36,900 | -- | |
| Regions Bank | $44,000 | -- | |
| Vega Raymond A | $38,000 | -- | |
| Abel Christina | -- | -- | |
| Abel Christina | -- | -- | |
| Merrick Michael K | $5,000 | -- |
Source: Public Records
Tax History Compared to Growth
Tax History
| Year | Tax Paid | Tax Assessment Tax Assessment Total Assessment is a certain percentage of the fair market value that is determined by local assessors to be the total taxable value of land and additions on the property. | Land | Improvement |
|---|---|---|---|---|
| 2024 | $427 | $24,950 | $3,600 | $21,350 |
| 2022 | $311 | $14,450 | $3,150 | $11,300 |
| 2021 | $561 | $14,450 | $3,150 | $11,300 |
| 2020 | $558 | $14,450 | $3,150 | $11,300 |
| 2019 | $283 | $14,450 | $3,150 | $11,300 |
| 2018 | $507 | $11,875 | $2,250 | $9,625 |
| 2017 | $507 | $11,875 | $2,250 | $9,625 |
| 2016 | $505 | $11,875 | $2,250 | $9,625 |
| 2015 | $457 | $11,875 | $2,250 | $9,625 |
| 2014 | $427 | $11,875 | $2,250 | $9,625 |
Source: Public Records
Map
Nearby Homes
- 1003 1/2 E Watauga Ave
- 610 E Myrtle Ave
- 607 E Watauga Ave
- 611 E Holston Ave
- 1304 E Chilhowie Ave
- 1201 E 8th Ave Unit 4
- 7 Llewellyn Wood Rd
- 1411 E Unaka Ave
- 1501 E Fairview Ave
- 1106 E Market St
- 907 Baxter St
- 1009 E Main St
- 506 E 10th Ave
- 1605 E Myrtle Ave
- 1607 E Millard St
- 1510 E Chilhowie Ave
- 106 Water St
- 1701 E Millard St
- 1700 E Millard St
- 120 E Holston Ave
- 1 E Myrtle Ave
- 908 E Myrtle Ave
- 910 E Myrtle Ave
- 912 E Myrtle Ave
- 905 E Myrtle Ave
- 907 E Myrtle Ave
- 903 E Myrtle Ave
- 909 E Myrtle Ave
- 1417 Railroad St
- 901 E Myrtle Ave
- 911 E Myrtle Ave
- 913 E Myrtle Ave
- 824 E Myrtle Ave
- 915 E Myrtle Ave
- 1002 E Myrtle Ave
- 904 E Watauga Ave
- 902 E Watauga Ave
- 906 E Watauga Ave
- 900 E Watauga Ave
- 1001 E Myrtle Ave