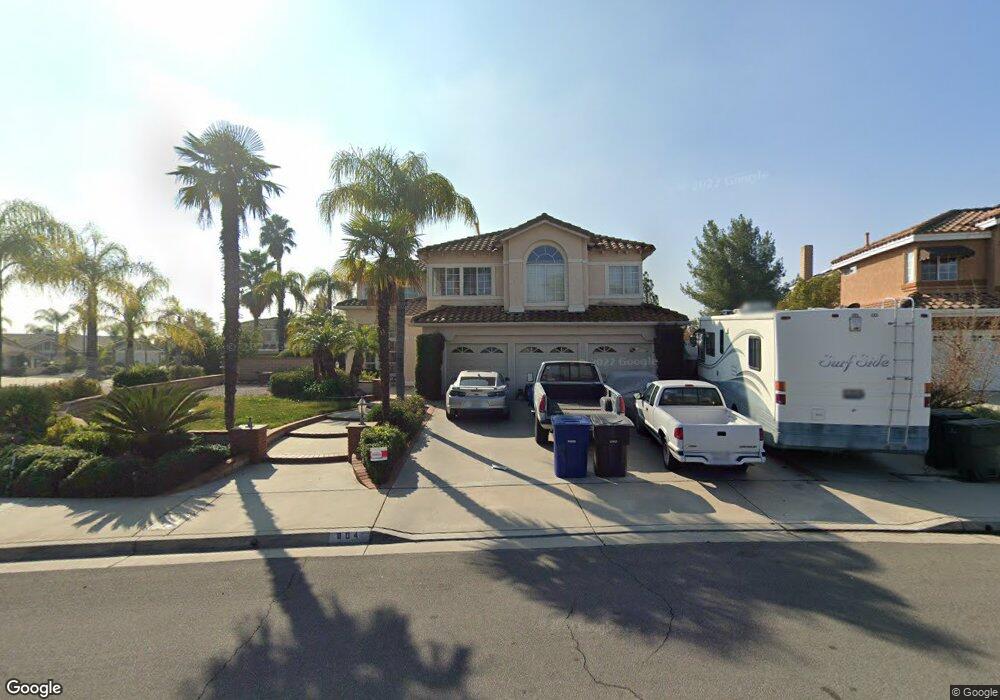
904 High View Dr Riverside, CA 92506
Mission Grove NeighborhoodEstimated Value: $844,171 - $939,000
5
Beds
3
Baths
2,650
Sq Ft
$332/Sq Ft
Est. Value
About This Home
This home is located at 904 High View Dr, Riverside, CA 92506 and is currently estimated at $879,543, approximately $331 per square foot. 904 High View Dr is a home located in Riverside County with nearby schools including William Howard Taft Elementary School, Amelia Earhart Middle School, and Martin Luther King Junior High School.
Ownership History
Date
Name
Owned For
Owner Type
Purchase Details
Closed on
Nov 1, 2016
Sold by
Danzek Alan R
Bought by
Danzek Alan R and Alan R Danzek Living Trust
Current Estimated Value
Purchase Details
Closed on
Feb 2, 2011
Sold by
Muldoon John W and Muldoon Kimi D
Bought by
Danzek Alan R
Home Financials for this Owner
Home Financials are based on the most recent Mortgage that was taken out on this home.
Original Mortgage
$331,381
Outstanding Balance
$226,433
Interest Rate
4.75%
Mortgage Type
FHA
Estimated Equity
$653,110
Purchase Details
Closed on
May 24, 2005
Sold by
Dinisi James F and Dinisi Aleta L
Bought by
Muldoon John W and Muldoon Kimi D
Home Financials for this Owner
Home Financials are based on the most recent Mortgage that was taken out on this home.
Original Mortgage
$475,000
Interest Rate
6%
Mortgage Type
New Conventional
Create a Home Valuation Report for This Property
The Home Valuation Report is an in-depth analysis detailing your home's value as well as a comparison with similar homes in the area
Home Values in the Area
Average Home Value in this Area
Purchase History
| Date | Buyer | Sale Price | Title Company |
|---|---|---|---|
| Danzek Alan R | -- | None Available | |
| Danzek Alan R | $340,000 | Fidelity National Title | |
| Muldoon John W | $595,000 | Chicago Title Company |
Source: Public Records
Mortgage History
| Date | Status | Borrower | Loan Amount |
|---|---|---|---|
| Open | Danzek Alan R | $331,381 | |
| Previous Owner | Muldoon John W | $475,000 |
Source: Public Records
Tax History
| Year | Tax Paid | Tax Assessment Tax Assessment Total Assessment is a certain percentage of the fair market value that is determined by local assessors to be the total taxable value of land and additions on the property. | Land | Improvement |
|---|---|---|---|---|
| 2025 | $4,730 | $435,586 | $102,486 | $333,100 |
| 2023 | $4,730 | $418,673 | $98,507 | $320,166 |
| 2022 | $4,622 | $410,465 | $96,576 | $313,889 |
| 2021 | $4,561 | $402,418 | $94,683 | $307,735 |
| 2020 | $4,527 | $398,293 | $93,713 | $304,580 |
| 2019 | $4,442 | $390,484 | $91,876 | $298,608 |
| 2018 | $4,356 | $382,828 | $90,075 | $292,753 |
| 2017 | $4,279 | $375,322 | $88,309 | $287,013 |
| 2016 | $4,004 | $367,964 | $86,578 | $281,386 |
| 2015 | $3,947 | $362,439 | $85,279 | $277,160 |
| 2014 | $3,911 | $355,341 | $83,609 | $271,732 |
Source: Public Records
Map
Nearby Homes
- 120 Sandpoint Ln
- 7320 Barnstable Place
- 200 E Alessandro Blvd Unit 94
- 901 Clearwood Ave
- 7639 Hillhurst Dr
- 7158 Golden Vale Dr
- 14435 Wood Rd
- 6746 Alderpoint Ct
- 7007 Golden Vale Dr
- 14420 Merlot Ct
- 14119 Ashton Ln
- 7390 Corinthian Way
- 1087 Mission Grove Pkwy N
- 6910 Sandtrack Rd
- 4170 Sydney Harbour Dr
- 6801 Rycroft Dr
- 6568 Balzac Cir
- 8004 Palm View Ln
- 14787 Wood Rd
- 1719 Crystal Ridge Ct
- 912 High View Dr
- 7271 Wood Rd
- 7252 Wood Rd
- 920 High View Dr
- 909 High View Dr
- 7264 Wood Rd
- 7240 Wood Rd
- 7283 Wood Rd
- 7276 Wood Rd
- 928 High View Dr
- 107 Bracebridge Rd
- 921 High View Dr
- 7288 Wood Rd
- 111 Sandpoint Ln
- 110 Sandpoint Ln
- 115 Bracebridge Rd
- 121 Sandpoint Ln
- 7197 Wood Rd
- 118 Port Royal Way
- 126 Port Royal Way
Your Personal Tour Guide
Ask me questions while you tour the home.