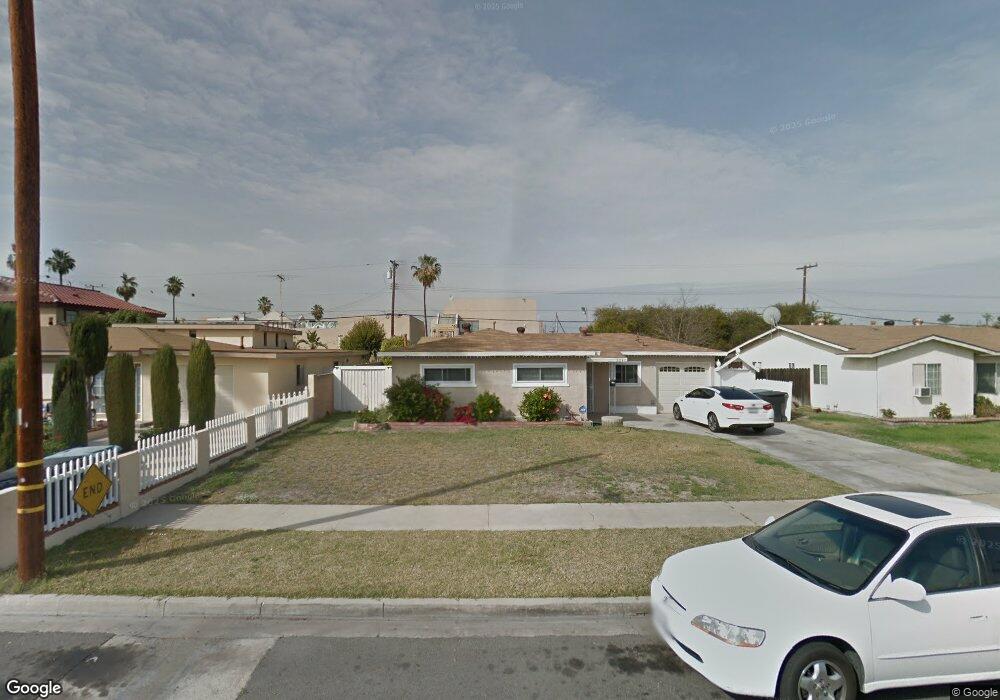
9041 Reading Ave Westminster, CA 92683
Little Saigon NeighborhoodEstimated Value: $767,000 - $941,000
3
Beds
1
Bath
960
Sq Ft
$881/Sq Ft
Est. Value
About This Home
This home is located at 9041 Reading Ave, Westminster, CA 92683 and is currently estimated at $845,640, approximately $880 per square foot. 9041 Reading Ave is a home located in Orange County with nearby schools including Merton E. Hill Elementary School, Donald S. Jordan Intermediate School, and Bolsa Grande High School.
Ownership History
Date
Name
Owned For
Owner Type
Purchase Details
Closed on
Apr 13, 2022
Sold by
Pham Green Brenda and Travis Brian
Bought by
Green Brenda Pham and Greem Brian Travis
Current Estimated Value
Home Financials for this Owner
Home Financials are based on the most recent Mortgage that was taken out on this home.
Original Mortgage
$395,000
Outstanding Balance
$368,116
Interest Rate
4.16%
Mortgage Type
New Conventional
Estimated Equity
$477,524
Purchase Details
Closed on
Feb 5, 2014
Sold by
Dinh Nga Thi
Bought by
Green Brian Travis and Dinh Brenda Pham
Purchase Details
Closed on
Jul 2, 2013
Sold by
Lasalle Bank National Association
Bought by
Green Brian Travis and Dinh Brenda Pham
Purchase Details
Closed on
Jan 31, 2008
Sold by
Reynoso Laura and Reynoso Saul
Bought by
Lasalle Bank Na and Mlmi Trust Series 2006-He3
Purchase Details
Closed on
Oct 28, 2003
Sold by
Garcia Bruno L and Reynoso Minerva D
Bought by
Reynoso Saul and Reynoso Andlaura
Home Financials for this Owner
Home Financials are based on the most recent Mortgage that was taken out on this home.
Original Mortgage
$252,000
Interest Rate
5.25%
Mortgage Type
Purchase Money Mortgage
Purchase Details
Closed on
Apr 16, 2000
Sold by
Garcia Gilberto L and Garcia Elmer L
Bought by
Garcia Bruno L and Reynoso Minerva D
Create a Home Valuation Report for This Property
The Home Valuation Report is an in-depth analysis detailing your home's value as well as a comparison with similar homes in the area
Home Values in the Area
Average Home Value in this Area
Purchase History
| Date | Buyer | Sale Price | Title Company |
|---|---|---|---|
| Green Brenda Pham | -- | North American Title | |
| Green Brian Travis | -- | None Available | |
| Green Brian Travis | -- | None Available | |
| Lasalle Bank Na | $323,725 | None Available | |
| Reynoso Saul | $315,000 | Chicago Title Co | |
| Garcia Bruno L | -- | Gateway Title |
Source: Public Records
Mortgage History
| Date | Status | Borrower | Loan Amount |
|---|---|---|---|
| Open | Green Brenda Pham | $395,000 | |
| Previous Owner | Reynoso Saul | $252,000 | |
| Closed | Reynoso Saul | $63,000 |
Source: Public Records
Tax History
| Year | Tax Paid | Tax Assessment Tax Assessment Total Assessment is a certain percentage of the fair market value that is determined by local assessors to be the total taxable value of land and additions on the property. | Land | Improvement |
|---|---|---|---|---|
| 2025 | $5,164 | $411,883 | $359,777 | $52,106 |
| 2024 | $5,164 | $403,807 | $352,722 | $51,085 |
| 2023 | $5,064 | $395,890 | $345,806 | $50,084 |
| 2022 | $4,916 | $388,128 | $339,026 | $49,102 |
| 2021 | $4,846 | $380,518 | $332,378 | $48,140 |
| 2020 | $4,784 | $376,617 | $328,970 | $47,647 |
| 2019 | $4,698 | $369,233 | $322,520 | $46,713 |
| 2018 | $4,609 | $361,994 | $316,196 | $45,798 |
| 2017 | $4,551 | $354,897 | $309,997 | $44,900 |
| 2016 | $4,366 | $347,939 | $303,919 | $44,020 |
| 2015 | $4,309 | $342,713 | $299,354 | $43,359 |
| 2014 | $4,209 | $336,000 | $293,490 | $42,510 |
Source: Public Records
Map
Nearby Homes
- 9121 Reading Ave
- 9200 Westminster Blvd Unit 71
- 9141 Jennrich Ave
- 13950 Magnolia St
- 8922 Jennrich Ave
- 14081 Magnolia St Unit 140
- 8952 Mcclure Ave
- 8784 Hewitt Place Unit 12
- 14172 Swan St
- 13711 Magnolia St
- 9180 Tropic Dr
- 8842 Enloe Ave
- 14642 Birch St
- 14331 Riata St
- 14362 Bushard St Unit 17
- 9619 Hazard Ave
- 8412 Sterling Way
- 9031 Washington Ave
- 9151 Carl Ln
- 14501 Wilson St
- 9051 Reading Ave
- 9031 Reading Ave
- 9061 Reading Ave
- 9021 Reading Ave
- 9081 Reading Ave
- 14092 Magnolia St
- 9001 Reading Ave
- 9032 Reading Ave
- 9052 Reading Ave
- 9062 Reading Ave
- 9022 Reading Ave
- 9091 Reading Ave
- 9082 Reading Ave
- 9002 Reading Ave
- 9092 Reading Ave
- 9101 Reading Ave
- 9051 Oasis Ave
- 9031 Oasis Ave
- 9061 Oasis Ave
- 9021 Oasis Ave
Your Personal Tour Guide
Ask me questions while you tour the home.