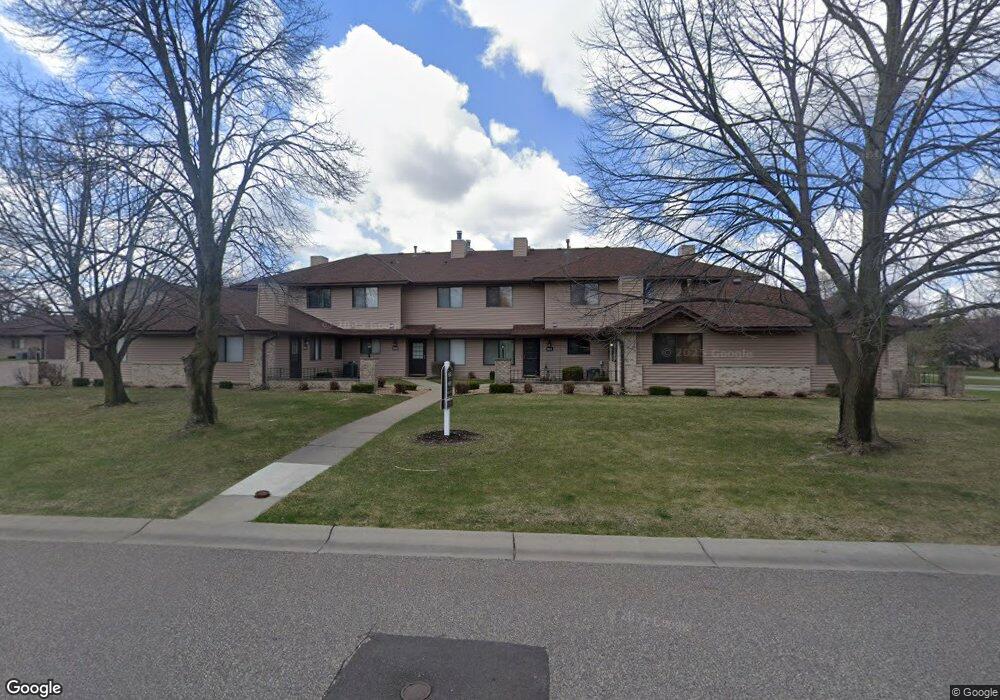
9045 Underwood Ln N Unit 9045 Maple Grove, MN 55369
Estimated Value: $222,000 - $239,000
2
Beds
2
Baths
1,100
Sq Ft
$206/Sq Ft
Est. Value
About This Home
This home is located at 9045 Underwood Ln N Unit 9045, Maple Grove, MN 55369 and is currently estimated at $226,804, approximately $206 per square foot. 9045 Underwood Ln N Unit 9045 is a home located in Hennepin County with nearby schools including Rice Lake Elementary School, Osseo Middle School, and Maple Grove Senior High School.
Ownership History
Date
Name
Owned For
Owner Type
Purchase Details
Closed on
Jun 21, 2016
Sold by
Hampton Real Estate Llc
Bought by
Hampton Jeffrey A
Current Estimated Value
Home Financials for this Owner
Home Financials are based on the most recent Mortgage that was taken out on this home.
Original Mortgage
$55,575
Interest Rate
3.66%
Mortgage Type
New Conventional
Purchase Details
Closed on
Mar 8, 2016
Sold by
Jpmorgan Chase Bank National Association
Bought by
Hampton Real Estate Llc
Purchase Details
Closed on
Jul 28, 2015
Sold by
Osmond Thomas M and Volkenant Jeanne M
Bought by
Jpmorgan Chase Bank National Associaton
Purchase Details
Closed on
Mar 12, 2003
Sold by
Medenwaldt Holli A
Bought by
Volkenant Jeanne M
Purchase Details
Closed on
Sep 29, 2000
Sold by
Cyr Jody M
Bought by
Medenwaldt Holli A
Purchase Details
Closed on
Jul 17, 1998
Sold by
Matt Jason M and Matt Christina L
Bought by
Cyr Jody M
Create a Home Valuation Report for This Property
The Home Valuation Report is an in-depth analysis detailing your home's value as well as a comparison with similar homes in the area
Home Values in the Area
Average Home Value in this Area
Purchase History
| Date | Buyer | Sale Price | Title Company |
|---|---|---|---|
| Hampton Jeffrey A | -- | Title Specialists Inc | |
| Hampton Real Estate Llc | $74,100 | Attorney | |
| Jpmorgan Chase Bank National Associaton | $90,250 | Attorney | |
| Volkenant Jeanne M | $141,500 | -- | |
| Medenwaldt Holli A | $119,900 | -- | |
| Cyr Jody M | $84,900 | -- |
Source: Public Records
Mortgage History
| Date | Status | Borrower | Loan Amount |
|---|---|---|---|
| Closed | Hampton Jeffrey A | $55,575 |
Source: Public Records
Tax History Compared to Growth
Tax History
| Year | Tax Paid | Tax Assessment Tax Assessment Total Assessment is a certain percentage of the fair market value that is determined by local assessors to be the total taxable value of land and additions on the property. | Land | Improvement |
|---|---|---|---|---|
| 2024 | $2,781 | $212,100 | $71,600 | $140,500 |
| 2023 | $2,506 | $196,500 | $59,300 | $137,200 |
| 2022 | $2,311 | $197,500 | $53,000 | $144,500 |
| 2021 | $2,245 | $173,800 | $46,800 | $127,000 |
| 2020 | $2,216 | $165,600 | $43,200 | $122,400 |
| 2019 | $2,109 | $155,000 | $41,300 | $113,700 |
| 2018 | $1,951 | $138,500 | $33,200 | $105,300 |
| 2017 | $1,528 | $112,600 | $23,500 | $89,100 |
| 2016 | $1,281 | $108,600 | $23,500 | $85,100 |
| 2015 | $1,125 | $96,700 | $18,000 | $78,700 |
| 2014 | -- | $87,800 | $18,000 | $69,800 |
Source: Public Records
Map
Nearby Homes
- 9061 Underwood Ln N
- 13351 90th Place N
- 8949 Rosewood Ln N
- 13590 89th Ave N
- 8735 Rosewood Ln N
- 12599 91st Place N
- 12769 88th Ave N
- 13885 93rd Place N
- 13744 94th Ave N
- 12509 88th Ave N
- 8829 Dallas Ln N
- 9323 Magnolia Ln N
- 8567 Xenium Ln N
- 12795 95th Ave N
- 9323 Kirkwood Ln N
- 9132 Kirkwood Ln N
- 9311 Kirkwood Ln N
- 9421 Dallas Ln N
- 13898 85th Place N
- 14402 91st Place N
- 9047 Underwood Ln N
- 9051 Underwood Ln N
- 9041 Underwood Ln N Unit 9041
- 9055 Underwood Ln N
- 9053 Underwood Ln N Unit 9053
- 9049 Underwood Ln N
- 9043 Underwood Ln N
- 13265 90th Place N
- 13263 90th Place N
- 13261 90th Place N Unit 3261
- 13255 90th Place N Unit 3255
- 13253 90th Place N
- 13251 90th Place N Unit 3251
- 13257 13257 90th-Place-n
- 13257 13257 90th Place N
- 13265 13265 90th Place N
- 13263 13263 90th Place N
- 13259 90th Place N
- 13257 90th Place N
- 13260 90th Ave N Unit 13260