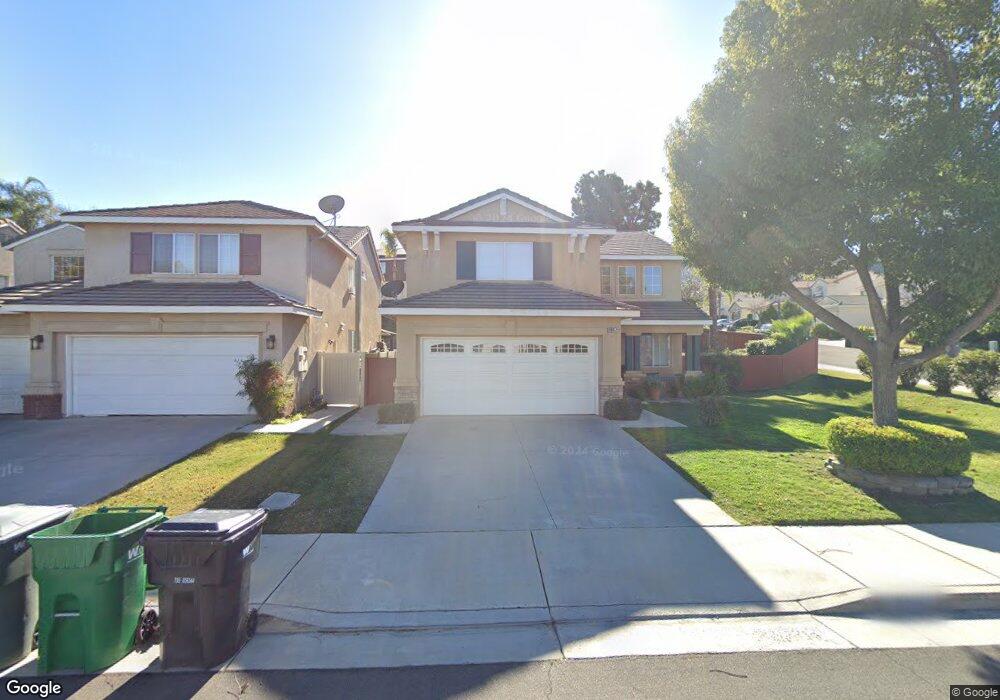
9047 Gold Fields Cir Corona, CA 92883
Wildrose NeighborhoodEstimated Value: $699,000 - $727,000
3
Beds
3
Baths
1,734
Sq Ft
$408/Sq Ft
Est. Value
About This Home
This home is located at 9047 Gold Fields Cir, Corona, CA 92883 and is currently estimated at $707,249, approximately $407 per square foot. 9047 Gold Fields Cir is a home located in Riverside County with nearby schools including Temescal Valley Elementary School, El Cerrito Middle School, and Santiago High School.
Ownership History
Date
Name
Owned For
Owner Type
Purchase Details
Closed on
Nov 9, 2017
Sold by
2017 2 Ih Borrower Lp
Bought by
2017 2 Ih Borrower Lp
Current Estimated Value
Home Financials for this Owner
Home Financials are based on the most recent Mortgage that was taken out on this home.
Original Mortgage
$865,027,000
Outstanding Balance
$724,851,435
Interest Rate
3.85%
Mortgage Type
Construction
Estimated Equity
-$724,144,186
Purchase Details
Closed on
Mar 4, 2013
Sold by
Tate James C and Tate Lisa A
Bought by
Thr California Lp
Purchase Details
Closed on
Nov 11, 1997
Sold by
Beazer Homes Holdings Corp
Bought by
Tate James C and Tate Lisa A
Home Financials for this Owner
Home Financials are based on the most recent Mortgage that was taken out on this home.
Original Mortgage
$153,753
Interest Rate
7.22%
Mortgage Type
FHA
Create a Home Valuation Report for This Property
The Home Valuation Report is an in-depth analysis detailing your home's value as well as a comparison with similar homes in the area
Home Values in the Area
Average Home Value in this Area
Purchase History
| Date | Buyer | Sale Price | Title Company |
|---|---|---|---|
| 2017 2 Ih Borrower Lp | -- | None Available | |
| Thr California Lp | $288,200 | Chicago Title Company | |
| Tate James C | $157,000 | Investors Title Company |
Source: Public Records
Mortgage History
| Date | Status | Borrower | Loan Amount |
|---|---|---|---|
| Open | 2017 2 Ih Borrower Lp | $865,027,000 | |
| Previous Owner | Tate James C | $153,753 |
Source: Public Records
Tax History Compared to Growth
Tax History
| Year | Tax Paid | Tax Assessment Tax Assessment Total Assessment is a certain percentage of the fair market value that is determined by local assessors to be the total taxable value of land and additions on the property. | Land | Improvement |
|---|---|---|---|---|
| 2025 | $5,048 | $458,425 | $110,252 | $348,173 |
| 2023 | $5,048 | $440,626 | $105,972 | $334,654 |
| 2022 | $4,887 | $431,988 | $103,895 | $328,093 |
| 2021 | $4,790 | $423,518 | $101,858 | $321,660 |
| 2020 | $4,737 | $419,176 | $100,814 | $318,362 |
| 2019 | $4,627 | $410,958 | $98,838 | $312,120 |
| 2018 | $4,523 | $402,900 | $96,900 | $306,000 |
| 2017 | $3,426 | $305,575 | $74,270 | $231,305 |
| 2016 | $3,394 | $299,584 | $72,814 | $226,770 |
| 2015 | $3,320 | $360,000 | $100,000 | $260,000 |
| 2014 | $3,552 | $289,306 | $70,317 | $218,989 |
Source: Public Records
Map
Nearby Homes
- 9121 Gold Fields Cir
- 22810 Mountain Ash Cir
- 22701 Hannah Ct
- 22801 Hannah Ct
- 8863 Crest View Dr
- 8875 Soothing Ct
- 8851 Soothing Ct
- 8824 Soothing Ct
- 19980 Temescal Canyon Rd
- 8832 Gentle Wind Dr
- 9510 Nickellaus Ct
- 9387 Hot Springs Rd
- 22315 Hayworth Ct
- 23375 Toronja Corte
- 0 Retreat Pkwy
- 8800 Camino Limon Rd
- 8656 Calle Canon Rd
- 8628 Calle Canon Rd
- 8335 Sunset Rose Dr
- 23649 Cantara Rd
- 9063 Gold Fields Cir
- 9042 Pink Moss Ct
- 9079 Gold Fields Cir
- 9058 Pink Moss Ct
- 22831 Sunrose St
- 22823 Sunrose St
- 22839 Sunrose St
- 9095 Gold Fields Cir
- 9074 Pink Moss Ct
- 9044 Gold Fields Cir
- 9060 Gold Fields Cir
- 22815 Sunrose St
- 22847 Sunrose St
- 9076 Gold Fields Cir
- 9090 Pink Moss Ct
- 22807 Sunrose St
- 22855 Sunrose St
- 9092 Gold Fields Cir
- 9106 Pink Moss Ct
- 22799 Sunrose St