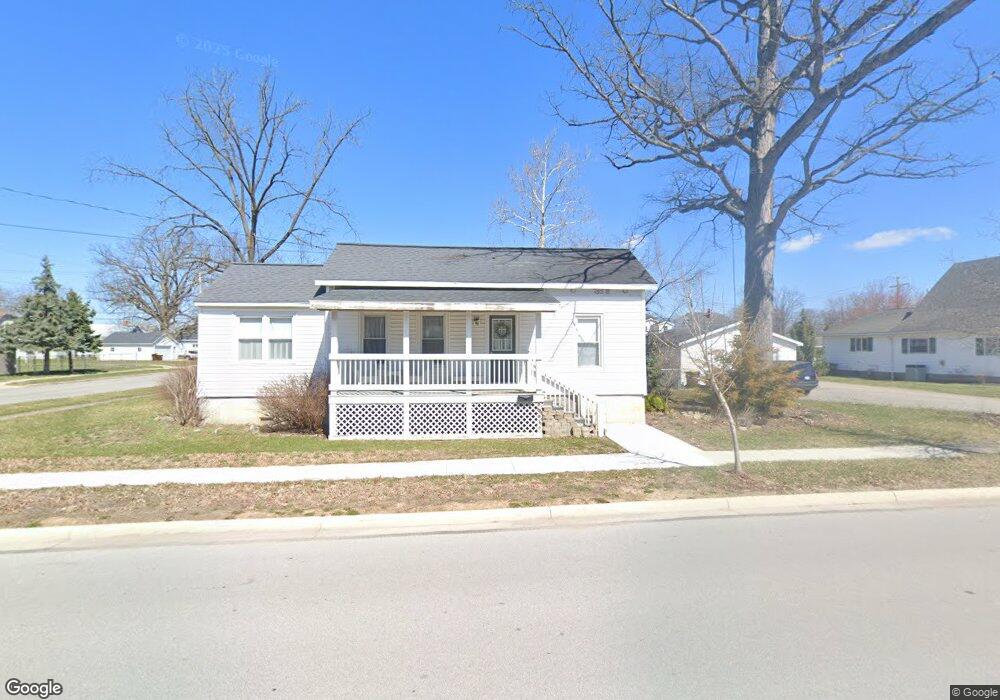
905 E 2nd St Ottawa, OH 45875
Estimated Value: $157,000 - $183,000
3
Beds
1
Bath
1,164
Sq Ft
$143/Sq Ft
Est. Value
About This Home
This home is located at 905 E 2nd St, Ottawa, OH 45875 and is currently estimated at $166,792, approximately $143 per square foot. 905 E 2nd St is a home located in Putnam County with nearby schools including Ottawa-Glandorf High School and Sts. Peter & Paul Catholic School.
Ownership History
Date
Name
Owned For
Owner Type
Purchase Details
Closed on
Dec 16, 2010
Sold by
The Fort Jennings State Bank
Bought by
Spangler Samuel W
Current Estimated Value
Home Financials for this Owner
Home Financials are based on the most recent Mortgage that was taken out on this home.
Original Mortgage
$40,952
Interest Rate
6.25%
Mortgage Type
Seller Take Back
Purchase Details
Closed on
Sep 15, 2010
Sold by
Jorgensen Randall H
Bought by
The Fort Jennings State Bank
Create a Home Valuation Report for This Property
The Home Valuation Report is an in-depth analysis detailing your home's value as well as a comparison with similar homes in the area
Home Values in the Area
Average Home Value in this Area
Purchase History
| Date | Buyer | Sale Price | Title Company |
|---|---|---|---|
| Spangler Samuel W | $45,000 | None Available | |
| The Fort Jennings State Bank | -- | None Available |
Source: Public Records
Mortgage History
| Date | Status | Borrower | Loan Amount |
|---|---|---|---|
| Closed | Spangler Samuel W | $40,952 |
Source: Public Records
Tax History
| Year | Tax Paid | Tax Assessment Tax Assessment Total Assessment is a certain percentage of the fair market value that is determined by local assessors to be the total taxable value of land and additions on the property. | Land | Improvement |
|---|---|---|---|---|
| 2025 | $1,102 | $32,250 | $5,300 | $26,950 |
| 2024 | $1,046 | $32,250 | $5,300 | $26,950 |
| 2023 | $1,079 | $25,290 | $4,080 | $21,210 |
| 2022 | $960 | $25,291 | $4,081 | $21,210 |
| 2021 | $964 | $25,290 | $4,080 | $21,210 |
| 2020 | $946 | $27,810 | $3,620 | $24,190 |
| 2019 | $857 | $22,820 | $4,080 | $18,740 |
| 2018 | $839 | $22,820 | $4,080 | $18,740 |
| 2017 | $1,039 | $22,820 | $4,080 | $18,740 |
| 2016 | $1,039 | $27,810 | $3,620 | $24,190 |
| 2015 | $954 | $25,350 | $3,620 | $21,730 |
| 2014 | $941 | $25,350 | $3,620 | $21,730 |
| 2013 | $939 | $25,350 | $3,620 | $21,730 |
Source: Public Records
Map
Nearby Homes
- 740 E Main St
- 717 E 2nd St
- 370 S Thomas St
- 238 N Ohio Ave
- 1535 E 3rd St
- 1823 S Agner St
- 0 Sapphire St Unit 225029940
- 0 Sapphire St Unit 225046385
- 715 N Perry St
- 1997 E Main St
- 717 & 717 1/2 & 721 E Third St
- 309 Oakview Dr
- #7 Oakview Dr
- #10 Oakview Dr
- #1 Oakview Dr
- #8 Oakview Dr
- #11 Oakview Dr
- #4 Oakview Dr
- #6 Oakview Dr
- #2 Oakview Dr
Your Personal Tour Guide
Ask me questions while you tour the home.