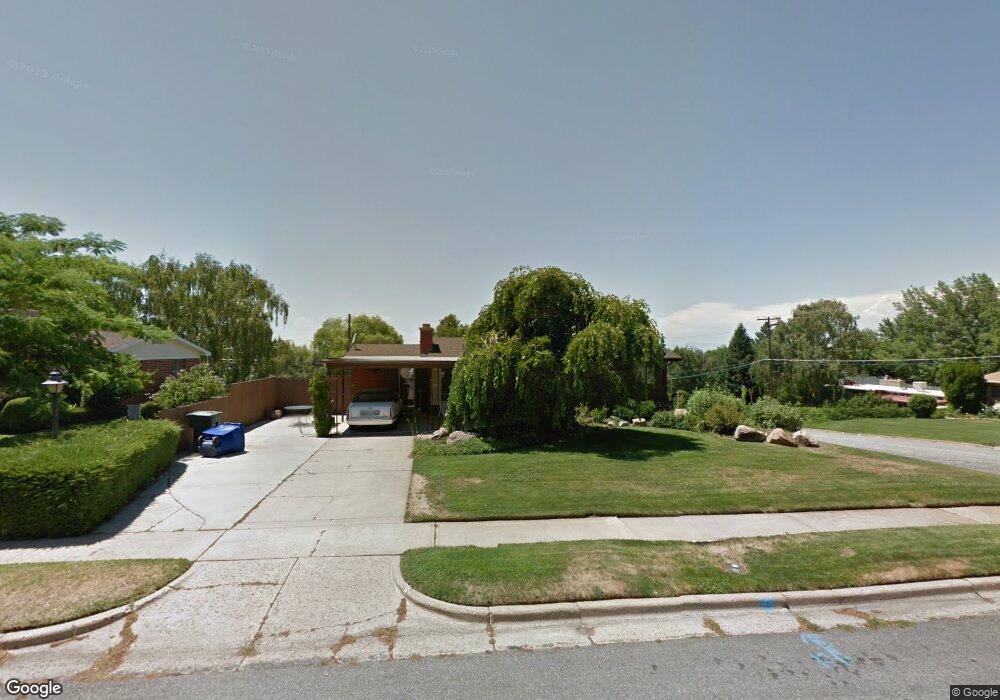
905 Fillmore Ave Ogden, UT 84404
Horace Mann NeighborhoodEstimated Value: $407,000 - $483,249
4
Beds
3
Baths
2,640
Sq Ft
$166/Sq Ft
Est. Value
About This Home
This home is located at 905 Fillmore Ave, Ogden, UT 84404 and is currently estimated at $439,062, approximately $166 per square foot. 905 Fillmore Ave is a home located in Weber County with nearby schools including Mound Fort Junior High School and Ben Lomond High School.
Ownership History
Date
Name
Owned For
Owner Type
Purchase Details
Closed on
Oct 27, 2014
Sold by
Fox Lisa and Thomas Lisa
Bought by
Thomas Lisa and Thomas Steven Ray
Current Estimated Value
Purchase Details
Closed on
Jul 18, 2013
Sold by
Wade Marilyn B
Bought by
Fox Lisa
Home Financials for this Owner
Home Financials are based on the most recent Mortgage that was taken out on this home.
Original Mortgage
$134,000
Outstanding Balance
$97,273
Interest Rate
3.88%
Mortgage Type
New Conventional
Estimated Equity
$341,789
Purchase Details
Closed on
Apr 23, 1997
Sold by
Wade Richard G and Wade Marilyn B
Bought by
Wade Richard G and Wade Marilyn B
Create a Home Valuation Report for This Property
The Home Valuation Report is an in-depth analysis detailing your home's value as well as a comparison with similar homes in the area
Home Values in the Area
Average Home Value in this Area
Purchase History
| Date | Buyer | Sale Price | Title Company |
|---|---|---|---|
| Thomas Lisa | -- | Bonneville Superior Title Co | |
| Fox Lisa | -- | Bonneville Superior Title Co | |
| Wade Richard G | -- | -- |
Source: Public Records
Mortgage History
| Date | Status | Borrower | Loan Amount |
|---|---|---|---|
| Open | Fox Lisa | $134,000 |
Source: Public Records
Tax History Compared to Growth
Tax History
| Year | Tax Paid | Tax Assessment Tax Assessment Total Assessment is a certain percentage of the fair market value that is determined by local assessors to be the total taxable value of land and additions on the property. | Land | Improvement |
|---|---|---|---|---|
| 2025 | $3,342 | $453,012 | $125,000 | $328,012 |
| 2024 | $3,197 | $429,000 | $125,005 | $303,995 |
| 2023 | $3,241 | $441,000 | $124,716 | $316,284 |
| 2022 | $3,437 | $260,150 | $55,012 | $205,138 |
| 2021 | $2,643 | $327,000 | $65,020 | $261,980 |
| 2020 | $2,402 | $273,000 | $49,957 | $223,043 |
| 2019 | $2,295 | $244,000 | $45,041 | $198,959 |
| 2018 | $2,175 | $229,000 | $45,041 | $183,959 |
| 2017 | $1,884 | $183,001 | $39,948 | $143,053 |
| 2016 | $1,790 | $93,755 | $19,119 | $74,636 |
| 2015 | $1,607 | $82,167 | $19,119 | $63,048 |
| 2014 | $1,627 | $82,167 | $16,424 | $65,743 |
Source: Public Records
Map
Nearby Homes
- 915 Hislop Dr
- 777 Simoron Dr
- 724 Hislop Dr
- 1410 12th St
- 1568 Hudson St Unit 1
- 1439 E 1250 S
- 446 Robins Ave
- 462 Hiland Rd
- 3270 N 3325 W Unit 386B
- 1631 E 1470 S Unit 5E
- 1696 E 1470 S Unit 14A
- 1698 E 1470 S
- 1120 Cross St
- 1243 Hudson St
- 1333 Lorl Ln Unit 6
- 1300 Lorl Ln Unit 2
- 1522 Robins Cir
- 1160 12th St
- 1274 5th St
- 622 Brinker Ave