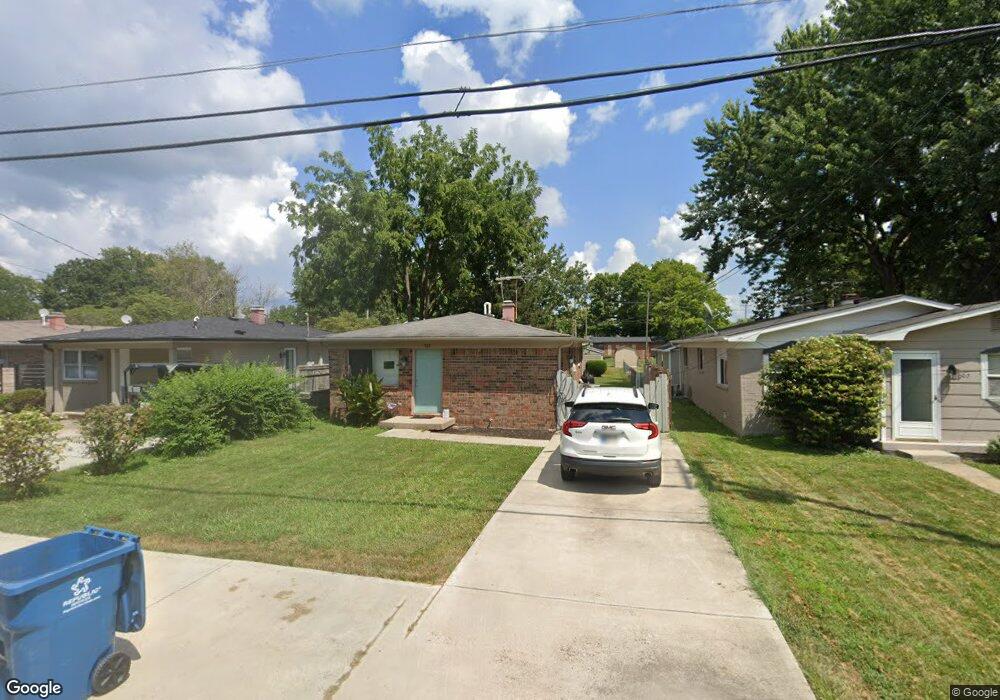
905 Main St Cicero, IN 46034
Estimated Value: $223,000 - $369,000
3
Beds
2
Baths
1,000
Sq Ft
$274/Sq Ft
Est. Value
About This Home
This home is located at 905 Main St, Cicero, IN 46034 and is currently estimated at $274,419, approximately $274 per square foot. 905 Main St is a home located in Hamilton County with nearby schools including Cicero Sda Elementary and Indiana Academy.
Ownership History
Date
Name
Owned For
Owner Type
Purchase Details
Closed on
Dec 7, 2009
Sold by
Sparr Roy L
Bought by
Appleseeds Llc
Current Estimated Value
Purchase Details
Closed on
Jan 12, 2007
Sold by
Walser Phyllis A
Bought by
Sparr Roy L
Home Financials for this Owner
Home Financials are based on the most recent Mortgage that was taken out on this home.
Original Mortgage
$89,800
Interest Rate
6.21%
Mortgage Type
Purchase Money Mortgage
Purchase Details
Closed on
Jan 16, 2002
Sold by
Walser Phyllis A
Bought by
Walser Phyllis A
Create a Home Valuation Report for This Property
The Home Valuation Report is an in-depth analysis detailing your home's value as well as a comparison with similar homes in the area
Home Values in the Area
Average Home Value in this Area
Purchase History
| Date | Buyer | Sale Price | Title Company |
|---|---|---|---|
| Appleseeds Llc | -- | Security Title Services Llc | |
| Sparr Roy L | -- | Chicago Title Insurance Co | |
| Walser Phyllis A | -- | -- |
Source: Public Records
Mortgage History
| Date | Status | Borrower | Loan Amount |
|---|---|---|---|
| Previous Owner | Sparr Roy L | $89,800 |
Source: Public Records
Tax History
| Year | Tax Paid | Tax Assessment Tax Assessment Total Assessment is a certain percentage of the fair market value that is determined by local assessors to be the total taxable value of land and additions on the property. | Land | Improvement |
|---|---|---|---|---|
| 2024 | $1,993 | $121,100 | $25,600 | $95,500 |
| 2023 | $1,993 | $104,700 | $25,600 | $79,100 |
| 2022 | $1,910 | $98,800 | $26,500 | $72,300 |
| 2021 | $1,884 | $94,500 | $26,500 | $68,000 |
| 2020 | $1,794 | $89,700 | $26,500 | $63,200 |
| 2019 | $1,608 | $80,400 | $14,700 | $65,700 |
| 2018 | $1,486 | $74,300 | $14,700 | $59,600 |
| 2017 | $1,466 | $73,300 | $14,700 | $58,600 |
| 2016 | $1,508 | $75,400 | $14,700 | $60,700 |
| 2014 | $1,380 | $69,000 | $14,700 | $54,300 |
| 2013 | $1,380 | $69,000 | $14,700 | $54,300 |
Source: Public Records
Map
Nearby Homes
Your Personal Tour Guide
Ask me questions while you tour the home.