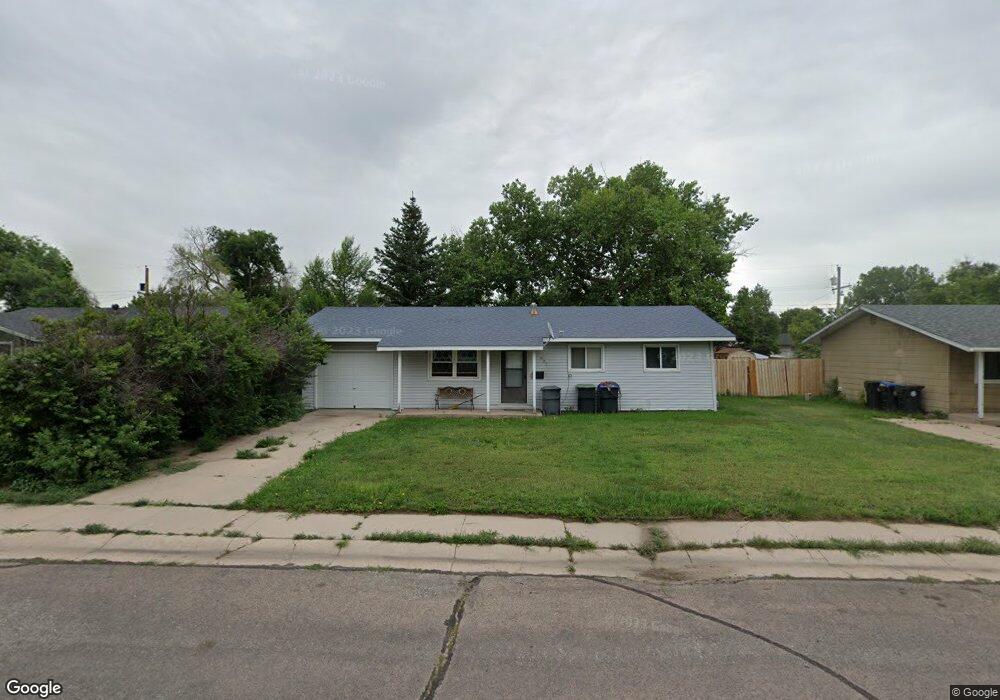
905 Stevens Dr Cheyenne, WY 82001
Estimated Value: $375,682 - $408,000
Studio
--
Bath
2,129
Sq Ft
$183/Sq Ft
Est. Value
About This Home
This home is located at 905 Stevens Dr, Cheyenne, WY 82001 and is currently estimated at $389,421, approximately $182 per square foot. 905 Stevens Dr is a home located in Laramie County with nearby schools including Lebhart Elementary School, Fairview Elementary School, and Johnson Junior High School.
Ownership History
Date
Name
Owned For
Owner Type
Purchase Details
Closed on
Dec 27, 2021
Sold by
Wanda Miller
Bought by
Storm Colton and Storm Brittaney
Current Estimated Value
Purchase Details
Closed on
Nov 21, 2011
Sold by
Meredith Rauchelle L
Bought by
Miller Stephen and Miller Wanda
Home Financials for this Owner
Home Financials are based on the most recent Mortgage that was taken out on this home.
Original Mortgage
$85,000
Interest Rate
3.99%
Mortgage Type
New Conventional
Purchase Details
Closed on
Sep 14, 2011
Sold by
Chubb William M and Chubb Rauchelle L
Bought by
Meridith Rauchelle L
Purchase Details
Closed on
Feb 10, 2006
Sold by
Hileman Terry and Hileman Kelly
Bought by
Chubb William M and Chubb Rauchelle L
Home Financials for this Owner
Home Financials are based on the most recent Mortgage that was taken out on this home.
Original Mortgage
$132,000
Interest Rate
6.18%
Mortgage Type
Fannie Mae Freddie Mac
Create a Home Valuation Report for This Property
The Home Valuation Report is an in-depth analysis detailing your home's value as well as a comparison with similar homes in the area
Purchase History
| Date | Buyer | Sale Price | Title Company |
|---|---|---|---|
| Storm Colton | -- | None Listed On Document | |
| Miller Stephen | -- | None Available | |
| Meridith Rauchelle L | -- | None Available | |
| Chubb William M | -- | None Available |
Source: Public Records
Mortgage History
| Date | Status | Borrower | Loan Amount |
|---|---|---|---|
| Previous Owner | Miller Stephen | $85,000 | |
| Previous Owner | Chubb William M | $132,000 | |
| Previous Owner | Chubb William M | $16,500 |
Source: Public Records
Tax History
| Year | Tax Paid | Tax Assessment Tax Assessment Total Assessment is a certain percentage of the fair market value that is determined by local assessors to be the total taxable value of land and additions on the property. | Land | Improvement |
|---|---|---|---|---|
| 2025 | $2,324 | $25,046 | $2,631 | $22,415 |
| 2024 | $2,324 | $31,530 | $3,508 | $28,022 |
| 2023 | $2,251 | $30,538 | $3,508 | $27,030 |
| 2022 | $1,911 | $25,425 | $1,452 | $23,973 |
| 2021 | $1,553 | $23,610 | $1,389 | $22,221 |
| 2020 | $1,221 | $19,245 | $1,225 | $18,020 |
| 2019 | $1,174 | $18,608 | $1,225 | $17,383 |
| 2018 | $1,070 | $17,357 | $1,225 | $16,132 |
| 2017 | $968 | $15,874 | $1,098 | $14,776 |
| 2016 | $944 | $15,555 | $1,098 | $14,457 |
| 2015 | $962 | $15,793 | $1,098 | $14,695 |
| 2014 | $1,028 | $16,576 | $1,380 | $15,196 |
Source: Public Records
Map
Nearby Homes
- 902 Stevens Dr
- 840 Stevens Dr
- 821 Stevens Dr
- 956 Hillcrest Rd
- 3331 Belaire Ave
- 810 Cahill Dr
- 7723 Three Hearts Trail
- 1101 Rosebud Rd
- 1026 Baldwin Dr
- 4022 E 7th St
- Lot 2 E 13th St
- 3241 Acacia Dr
- 3248 Acacia Dr
- 3424 Frontier St
- 3319 Myers Ct
- 3425 Myers Ct
- 4318 E 8th St
- 2985 Henderson Dr
- 2709 E 9th St
- 2621 E 10th St
- 905 Stevens Dr
- 909 Stevens Dr
- 909 Stevens Dr
- 843 Stevens Dr
- 910 Stevens Dr
- 912 Stevens Dr
- 904 Hillcrest Rd
- 918 Stevens Dr
- 837 Stevens Dr
- 844 Hillcrest Rd
- 915 Stevens Dr
- 915 Stevens Dr
- 913 Stevens Dr
- 838 Hillcrest Rd
- 831 Stevens Dr
- 914 Hillcrest Rd
- 908 Stevens Dr
- 846 Stevens Dr
- 921 Stevens Dr
- 832 Hillcrest Rd
Your Personal Tour Guide
Ask me questions while you tour the home.