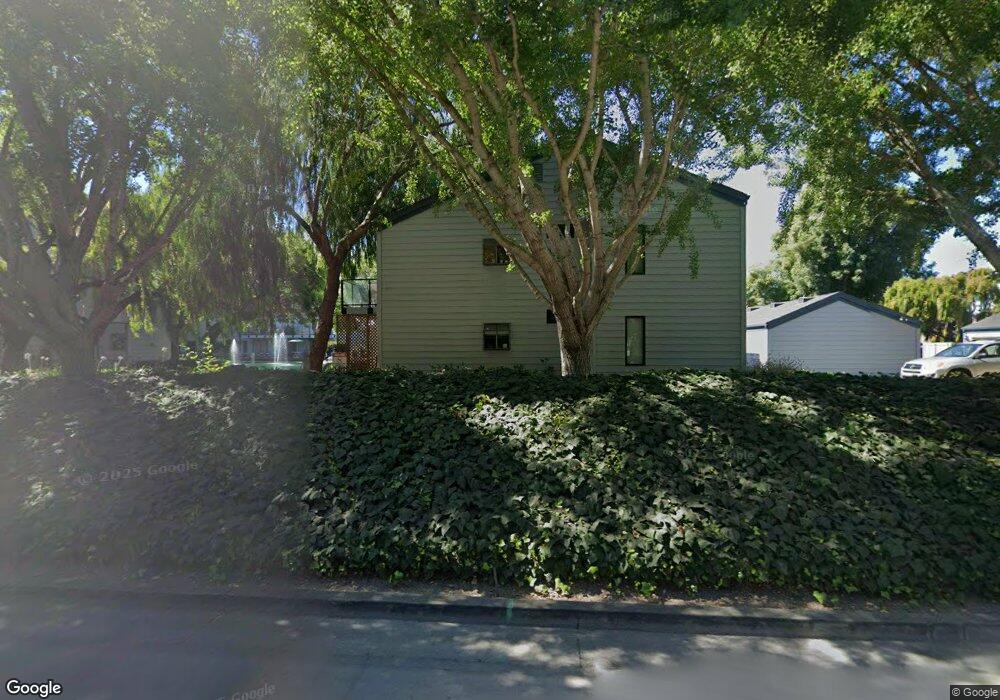
905 W Middlefield Rd Unit 924 Mountain View, CA 94043
Rex Manor NeighborhoodEstimated Value: $930,000 - $1,459,000
2
Beds
2
Baths
998
Sq Ft
$1,070/Sq Ft
Est. Value
About This Home
This home is located at 905 W Middlefield Rd Unit 924, Mountain View, CA 94043 and is currently estimated at $1,067,765, approximately $1,069 per square foot. 905 W Middlefield Rd Unit 924 is a home located in Santa Clara County with nearby schools including Theuerkauf Elementary School, Crittenden Middle School, and Mountain View High School.
Ownership History
Date
Name
Owned For
Owner Type
Purchase Details
Closed on
Sep 5, 2018
Sold by
Huber Britt and Oertli Erwin
Bought by
Shao Rui
Current Estimated Value
Home Financials for this Owner
Home Financials are based on the most recent Mortgage that was taken out on this home.
Original Mortgage
$794,490
Outstanding Balance
$681,674
Interest Rate
3.87%
Mortgage Type
Adjustable Rate Mortgage/ARM
Estimated Equity
$386,091
Purchase Details
Closed on
Sep 16, 2002
Sold by
Valdovinos Ernest and Valdovinos Marcia M
Bought by
Huber Britt and Oertli Erwin
Home Financials for this Owner
Home Financials are based on the most recent Mortgage that was taken out on this home.
Original Mortgage
$301,000
Interest Rate
5.5%
Purchase Details
Closed on
Jan 28, 1994
Sold by
Magee Marcy
Bought by
Valdovinos Ernest and Valdovinos Marcia M
Create a Home Valuation Report for This Property
The Home Valuation Report is an in-depth analysis detailing your home's value as well as a comparison with similar homes in the area
Home Values in the Area
Average Home Value in this Area
Purchase History
| Date | Buyer | Sale Price | Title Company |
|---|---|---|---|
| Shao Rui | $998,000 | First American Title | |
| Huber Britt | $385,000 | Financial Title Company | |
| Valdovinos Ernest | -- | -- |
Source: Public Records
Mortgage History
| Date | Status | Borrower | Loan Amount |
|---|---|---|---|
| Open | Shao Rui | $794,490 | |
| Previous Owner | Huber Britt | $301,000 |
Source: Public Records
Tax History Compared to Growth
Tax History
| Year | Tax Paid | Tax Assessment Tax Assessment Total Assessment is a certain percentage of the fair market value that is determined by local assessors to be the total taxable value of land and additions on the property. | Land | Improvement |
|---|---|---|---|---|
| 2025 | $11,524 | $930,000 | $465,000 | $465,000 |
| 2024 | $11,524 | $945,000 | $472,500 | $472,500 |
| 2023 | $11,237 | $915,000 | $457,500 | $457,500 |
| 2022 | $13,058 | $1,049,076 | $524,538 | $524,538 |
| 2021 | $12,753 | $1,028,506 | $514,253 | $514,253 |
| 2020 | $12,679 | $1,017,960 | $508,980 | $508,980 |
| 2019 | $12,121 | $998,000 | $499,000 | $499,000 |
| 2018 | $6,159 | $490,054 | $294,033 | $196,021 |
| 2017 | $5,886 | $480,446 | $288,268 | $192,178 |
| 2016 | $5,688 | $471,026 | $282,616 | $188,410 |
| 2015 | $5,546 | $463,951 | $278,371 | $185,580 |
| 2014 | $5,481 | $454,864 | $272,919 | $181,945 |
Source: Public Records
Map
Nearby Homes
- 440 Moffett Blvd Unit 84
- 440 Moffett Blvd Unit 127
- 440 Moffett Blvd Unit 86
- 440 Moffett Blvd Unit 61
- 751 San Pablo Dr
- 932 Ormonde Dr
- 500 W Middlefield Rd Unit 122
- 500 W Middlefield Rd Unit 18
- 650 Alamo Ct Unit 5
- 505 Cypress Point Dr Unit 213
- 505 Cypress Point Dr Unit 245
- 505 Cypress Point Dr Unit 137
- 505 Cypress Point Dr Unit 40
- 730 Central Ave
- 820 Jackson St
- 284 Elmwood St
- 981 San Marcos Cir
- 1269 Verano Rd
- 0 Elmwood St
- 219 Horizon Ave
- 905 W Middlefield Rd Unit 932
- 905 W Middlefield Rd
- 905 W Middlefield Rd Unit 945
- 905 W Middlefield Rd
- 905 W Middlefield Rd Unit 928
- 905 W Middlefield Rd Unit 927
- 905 W Middlefield Rd Unit 926
- 905 W Middlefield Rd Unit 925
- 905 W Middlefield Rd Unit 922
- 905 W Middlefield Rd Unit 995
- 905 W Middlefield Rd Unit 994
- 905 W Middlefield Rd Unit 993
- 905 W Middlefield Rd Unit 992
- 905 W Middlefield Rd Unit 991
- 905 W Middlefield Rd Unit 988
- 905 W Middlefield Rd Unit 987
- 905 W Middlefield Rd Unit 986
- 905 W Middlefield Rd Unit 985
- 905 W Middlefield Rd Unit 984
- 905 W Middlefield Rd Unit 983