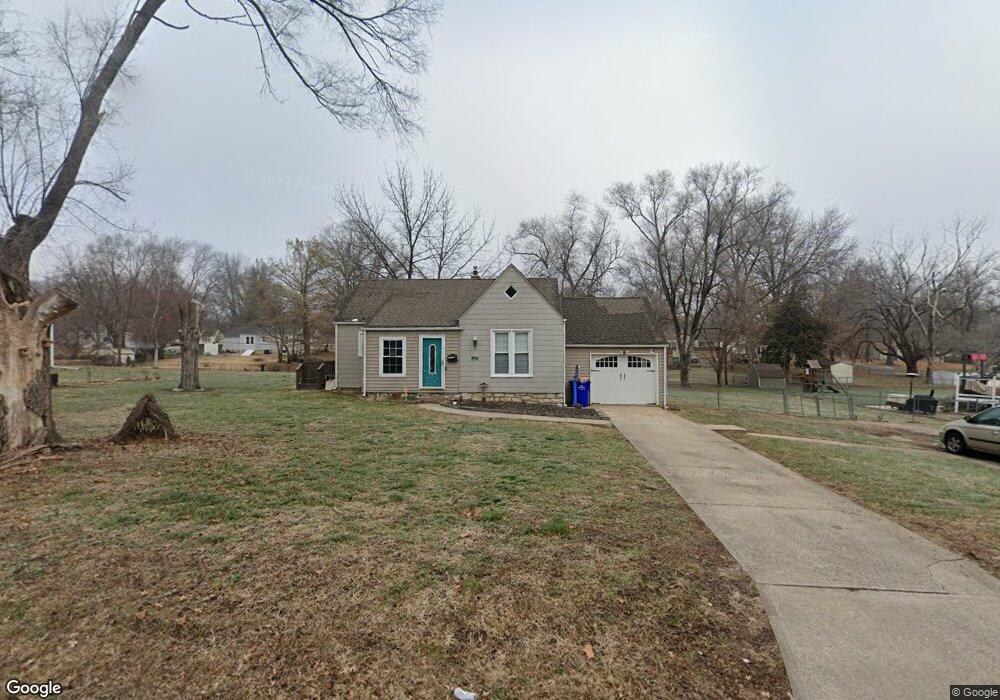
9058 E 66th Terrace Raytown, MO 64133
Estimated Value: $134,863 - $170,000
2
Beds
1
Bath
886
Sq Ft
$176/Sq Ft
Est. Value
About This Home
This home is located at 9058 E 66th Terrace, Raytown, MO 64133 and is currently estimated at $155,966, approximately $176 per square foot. 9058 E 66th Terrace is a home located in Jackson County with nearby schools including Blue Ridge Elementary School, Raytown Central Middle School, and Carver Christian Academy.
Ownership History
Date
Name
Owned For
Owner Type
Purchase Details
Closed on
Sep 10, 2010
Sold by
Vanderlinden Julie and Vanderlinden Steven D
Bought by
Benchmark Kc Llc
Current Estimated Value
Purchase Details
Closed on
Jun 19, 2006
Sold by
Jones James C and Jones Jennifer L
Bought by
Vanderlinden Steven D and Vanderlinden Julie
Home Financials for this Owner
Home Financials are based on the most recent Mortgage that was taken out on this home.
Original Mortgage
$68,800
Interest Rate
6.56%
Mortgage Type
Purchase Money Mortgage
Purchase Details
Closed on
Aug 20, 1996
Sold by
Porrevecchio Celine M and Porrevecchio Dan M
Bought by
Jones James C and Dodd Jennifer L
Home Financials for this Owner
Home Financials are based on the most recent Mortgage that was taken out on this home.
Original Mortgage
$52,709
Interest Rate
8.42%
Mortgage Type
FHA
Purchase Details
Closed on
Feb 26, 1996
Sold by
Gilmore Ronald L and Gilmore Barbara D
Bought by
Porrevecchio Celine M
Create a Home Valuation Report for This Property
The Home Valuation Report is an in-depth analysis detailing your home's value as well as a comparison with similar homes in the area
Home Values in the Area
Average Home Value in this Area
Purchase History
| Date | Buyer | Sale Price | Title Company |
|---|---|---|---|
| Benchmark Kc Llc | $24,601 | None Available | |
| Vanderlinden Steven D | -- | Kansas City Title | |
| Jones James C | -- | Columbia National Title Ins | |
| Porrevecchio Celine M | -- | -- |
Source: Public Records
Mortgage History
| Date | Status | Borrower | Loan Amount |
|---|---|---|---|
| Previous Owner | Vanderlinden Steven D | $68,800 | |
| Previous Owner | Jones James C | $52,709 |
Source: Public Records
Tax History
| Year | Tax Paid | Tax Assessment Tax Assessment Total Assessment is a certain percentage of the fair market value that is determined by local assessors to be the total taxable value of land and additions on the property. | Land | Improvement |
|---|---|---|---|---|
| 2025 | $1,152 | $12,814 | $6,164 | $6,650 |
| 2024 | $1,144 | $12,766 | $3,635 | $9,131 |
| 2023 | $1,144 | $12,766 | $3,224 | $9,542 |
| 2022 | $912 | $9,690 | $2,674 | $7,016 |
| 2021 | $915 | $9,690 | $2,674 | $7,016 |
| 2020 | $1,034 | $10,850 | $2,674 | $8,176 |
| 2019 | $1,028 | $10,850 | $2,674 | $8,176 |
| 2018 | $864 | $9,443 | $2,327 | $7,116 |
| 2016 | $814 | $8,950 | $3,131 | $5,819 |
Source: Public Records
Map
Nearby Homes
- 8920 Rose Ln
- 6824 Laurel Ave
- 9202 E 64th Terrace
- 9314 E 68th Terrace
- 8500 E State Route 350
- 6924 Hunter St
- 9616 E 66th St
- 6301 Kentucky Ave
- 9416 E 64th St
- 9609 E 68th St
- 9804 E 68 St
- 8705 E 63rd St
- 6121 Hunter St
- 7300 Elm Ave
- 10019 E 67th St
- 7317 Elm Ave
- 6310 Raytown Rd
- 10027 E 67th St
- 7209 Oxford Ave
- 9005 E 73rd St
- 9058 E 66 Terrace
- 9066 E 66th Terrace
- 9050 E 66th Terrace
- 9063 E 66th Terrace
- 9071 E 66th Terrace
- 9051 E 66th Terrace
- 6609 Laurel Ave
- 9008 E 66th Terrace
- 9059 E 66th St
- 9101 E 66 Terrace
- 9051 E 66th St
- 9063 E 66th St
- 9017 E 66th Terrace
- 9104 E 66th Terrace
- 9017 E 66th St
- 9004 E 66th Terrace
- 6601 Laurel Ave
- 9105 E 66th Terrace
- 9058 E 67th Terrace
- 9050 E 67th Terrace
Your Personal Tour Guide
Ask me questions while you tour the home.