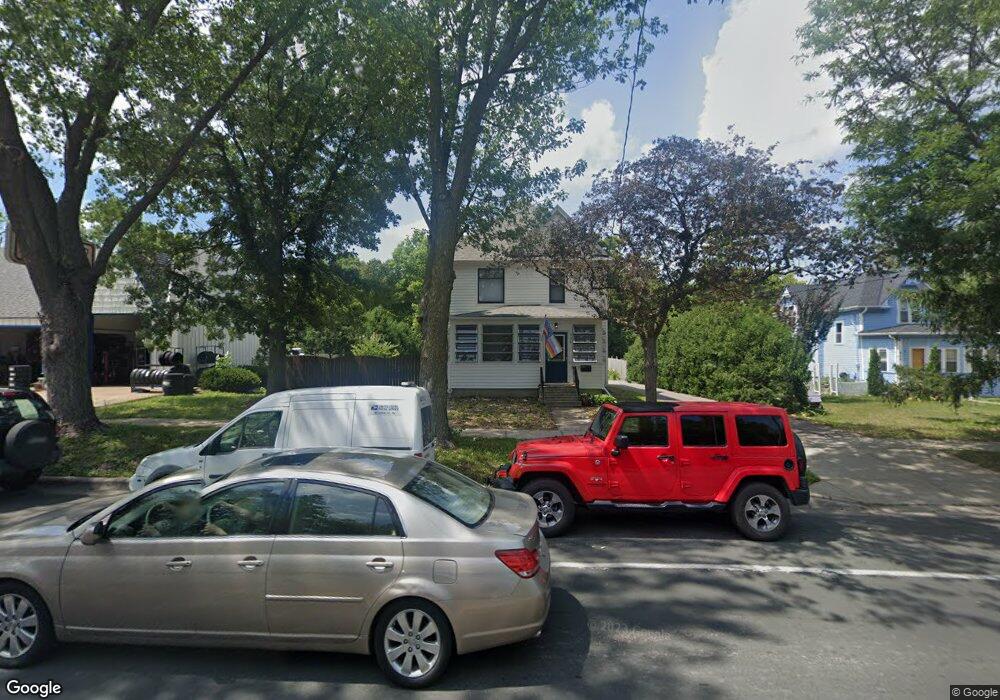
906 906 Division-Street-s Northfield, MN 55057
Estimated Value: $365,000 - $460,000
3
Beds
2
Baths
1,854
Sq Ft
$213/Sq Ft
Est. Value
About This Home
This home is located at 906 906 Division-Street-s, Northfield, MN 55057 and is currently estimated at $394,616, approximately $212 per square foot. 906 906 Division-Street-s is a home located in Rice County with nearby schools including Spring Creek Elementary, Northfield Middle School, and Northfield Senior High School.
Ownership History
Date
Name
Owned For
Owner Type
Purchase Details
Closed on
Feb 13, 2023
Sold by
Nichols Sinda B
Bought by
Nichols Sinda B and Tonks Nicholas E
Current Estimated Value
Purchase Details
Closed on
Feb 11, 2020
Sold by
Chavis Joshua and Chavis Cassandra
Bought by
Nichols Sinda B
Home Financials for this Owner
Home Financials are based on the most recent Mortgage that was taken out on this home.
Original Mortgage
$256,500
Interest Rate
3.6%
Mortgage Type
New Conventional
Purchase Details
Closed on
Jun 16, 2017
Sold by
Jansen Sarah
Bought by
Chavis Joshua and Chavis Cassandra
Home Financials for this Owner
Home Financials are based on the most recent Mortgage that was taken out on this home.
Original Mortgage
$189,905
Interest Rate
4.02%
Mortgage Type
New Conventional
Purchase Details
Closed on
Dec 21, 2007
Sold by
Costa Dominick M and Costa Bergetta M
Bought by
Carver Michael K
Create a Home Valuation Report for This Property
The Home Valuation Report is an in-depth analysis detailing your home's value as well as a comparison with similar homes in the area
Home Values in the Area
Average Home Value in this Area
Purchase History
| Date | Buyer | Sale Price | Title Company |
|---|---|---|---|
| Nichols Sinda B | -- | None Listed On Document | |
| Nichols Sinda B | $270,000 | Edina Realty Title Inc | |
| Chavis Joshua | $199,900 | Rice County Abstract & Title | |
| Carver Michael K | $180,000 | -- |
Source: Public Records
Mortgage History
| Date | Status | Borrower | Loan Amount |
|---|---|---|---|
| Previous Owner | Nichols Sinda B | $256,500 | |
| Previous Owner | Chavis Joshua | $189,905 |
Source: Public Records
Tax History Compared to Growth
Tax History
| Year | Tax Paid | Tax Assessment Tax Assessment Total Assessment is a certain percentage of the fair market value that is determined by local assessors to be the total taxable value of land and additions on the property. | Land | Improvement |
|---|---|---|---|---|
| 2025 | $5,726 | $349,700 | $72,100 | $277,600 |
| 2024 | $5,726 | $328,200 | $68,100 | $260,100 |
| 2023 | $4,800 | $328,200 | $68,100 | $260,100 |
| 2022 | $4,208 | $304,100 | $68,100 | $236,000 |
| 2021 | $3,790 | $262,000 | $58,100 | $203,900 |
| 2020 | $3,142 | $235,100 | $54,100 | $181,000 |
| 2019 | $2,954 | $195,200 | $50,100 | $145,100 |
| 2018 | $2,806 | $182,600 | $44,000 | $138,600 |
| 2017 | $2,532 | $171,800 | $44,000 | $127,800 |
| 2016 | $2,646 | $169,300 | $44,000 | $125,300 |
| 2015 | $2,632 | $168,100 | $44,000 | $124,100 |
| 2014 | -- | $168,100 | $44,000 | $124,100 |
Source: Public Records
Map
Nearby Homes
- 917 Division St S
- 1011 Poplar St
- 308 7th St E
- 1015 College St
- 405 8th St E
- 411 Washington St
- 408 5th St E
- 1409 Washington St
- 506 506 E 6th St
- TBB 403 (To Be Built College St
- XXXX Harvest Hills Outlook
- 1603 Washington St
- 1113 Elm St
- 701 3rd St W
- 504 2nd St W
- 101 Saint Olaf Ave Unit 404
- 101 Saint Olaf Ave Unit 104
- 101 Saint Olaf Ave Unit 407
- 101 St Olaf Ave N Unit 312
- 840 Fremont St E
- 906 Division St S
- 904 Division St S
- 904 904 Division-Street-s
- 114 Woodley St W
- 900 Division St S
- 900 900 Division-Street-s
- 909 909 Water-Street-s
- 909 Water St S
- 116 Woodley St W
- 909 Water St S
- 105 9th St W
- 1000 Division St S
- 913 Division St S
- 909 Division St S
- 905 Water St S
- 109 Woodley St W
- 903 Division St S
- 1002 Division St S
- 102 9th St E
- 115 Woodley St W