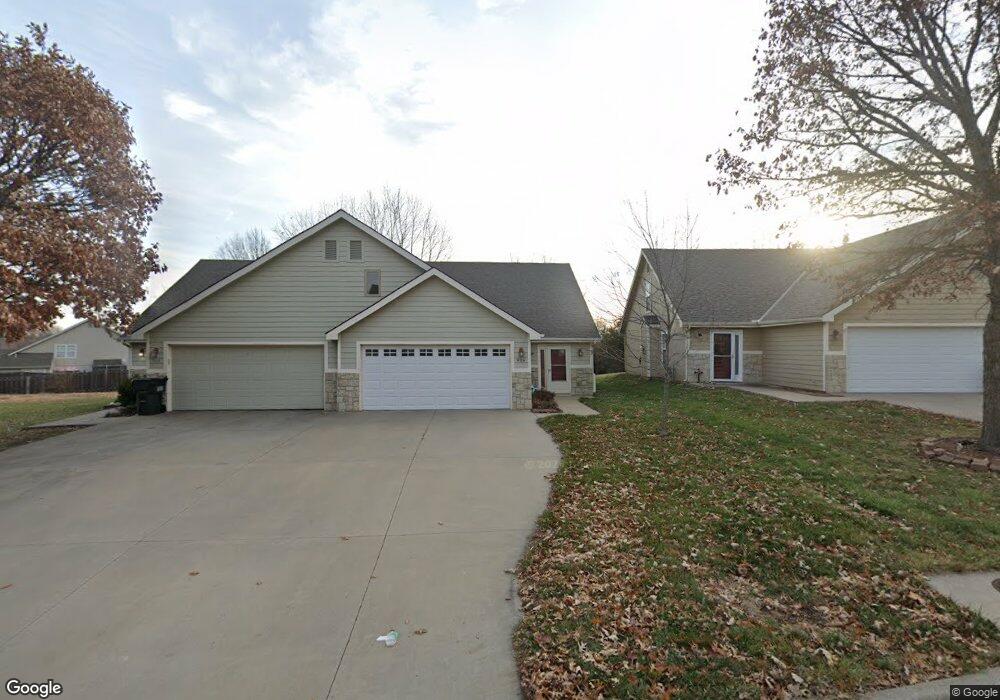
906 N Field Stone Dr Lawrence, KS 66049
Estimated Value: $267,000 - $278,897
3
Beds
2
Baths
1,634
Sq Ft
$166/Sq Ft
Est. Value
About This Home
This home is located at 906 N Field Stone Dr, Lawrence, KS 66049 and is currently estimated at $271,299, approximately $166 per square foot. 906 N Field Stone Dr is a home located in Douglas County with nearby schools including Deerfield Elementary School, West Middle School, and Lawrence Free State High School.
Ownership History
Date
Name
Owned For
Owner Type
Purchase Details
Closed on
Mar 29, 2010
Sold by
Clark Jennifer M and Jennifer M Clark Revocable Tru
Bought by
Pettijohn Renee
Current Estimated Value
Home Financials for this Owner
Home Financials are based on the most recent Mortgage that was taken out on this home.
Original Mortgage
$137,464
Outstanding Balance
$92,682
Interest Rate
5.25%
Mortgage Type
FHA
Estimated Equity
$178,617
Purchase Details
Closed on
Dec 23, 2008
Sold by
Clark John D
Bought by
Clark John D and John D Clark Revocable Trust
Purchase Details
Closed on
Jul 10, 2003
Sold by
Keystone Homes Inc
Bought by
Clark John D and Clark Jennifer M
Home Financials for this Owner
Home Financials are based on the most recent Mortgage that was taken out on this home.
Original Mortgage
$132,450
Interest Rate
5.19%
Mortgage Type
Purchase Money Mortgage
Create a Home Valuation Report for This Property
The Home Valuation Report is an in-depth analysis detailing your home's value as well as a comparison with similar homes in the area
Home Values in the Area
Average Home Value in this Area
Purchase History
| Date | Buyer | Sale Price | Title Company |
|---|---|---|---|
| Pettijohn Renee | -- | First American Title | |
| Clark John D | -- | None Available | |
| Clark Jennifer M | -- | None Available | |
| Clark John D | -- | Commerce Title |
Source: Public Records
Mortgage History
| Date | Status | Borrower | Loan Amount |
|---|---|---|---|
| Open | Pettijohn Renee | $137,464 | |
| Previous Owner | Clark John D | $132,450 |
Source: Public Records
Tax History Compared to Growth
Tax History
| Year | Tax Paid | Tax Assessment Tax Assessment Total Assessment is a certain percentage of the fair market value that is determined by local assessors to be the total taxable value of land and additions on the property. | Land | Improvement |
|---|---|---|---|---|
| 2025 | $3,583 | $29,291 | $5,175 | $24,116 |
| 2024 | $3,475 | $28,428 | $4,025 | $24,403 |
| 2023 | $3,268 | $25,657 | $4,025 | $21,632 |
| 2022 | $2,862 | $22,379 | $3,164 | $19,215 |
| 2021 | $2,462 | $18,573 | $3,679 | $14,894 |
| 2020 | $2,428 | $18,412 | $3,679 | $14,733 |
| 2019 | $2,282 | $17,342 | $2,991 | $14,351 |
| 2018 | $2,248 | $16,962 | $2,991 | $13,971 |
| 2017 | $2,141 | $15,996 | $2,991 | $13,005 |
| 2016 | $2,025 | $15,812 | $2,991 | $12,821 |
| 2015 | $2,009 | $15,686 | $2,991 | $12,695 |
| 2014 | $1,970 | $15,536 | $2,991 | $12,545 |
Source: Public Records
Map
Nearby Homes
- 826 N Field Stone Dr
- 946 N Field Stone Dr
- 732 N Blazing Star Dr
- 3413 Sweetgrass Ct
- 3512 Prairie Clover Ct
- 3508 Prairie Clover Ct
- 504 N Monterey Way
- 420 Winnie Way
- 1211 N 1800 Rd
- 406 N Olivia Ave
- 3112 Sherwood Dr
- Lot 2 Peterson Rd
- 3708 Buck Brush Ct
- Lot 1 Fall Creek Rd
- Lot 5 Weatherhill Cir
- 229 Deerfield Ln
- Lot 1 N Running Ridge Rd
- Lot 6 Weatherhill Cir
- 110 Glenview Dr
- 145 N Fall Creek Dr
- 906 N Fieldstone Dr
- 908 N Field Stone Dr
- 908 N Fieldstone Dr
- 904 N Field Stone Dr
- 904 N Fieldstone Dr
- 902 N Field Stone Dr
- 902 N Fieldstone Dr
- 3517 Fieldstone Ct
- 828 N Field Stone Dr
- 828 N Fieldstone Dr
- 3515 Fieldstone Ct
- 3515 Field Stone Ct
- 3513 Field Stone Ct
- 3513 Fieldstone Ct
- 826 N Fieldstone Dr
- 3511 Fieldstone Ct
- 3511 Field Stone Ct
- 909 N Field Stone Dr
- 3509 Fieldstone Ct
- 907 N Field Stone Dr