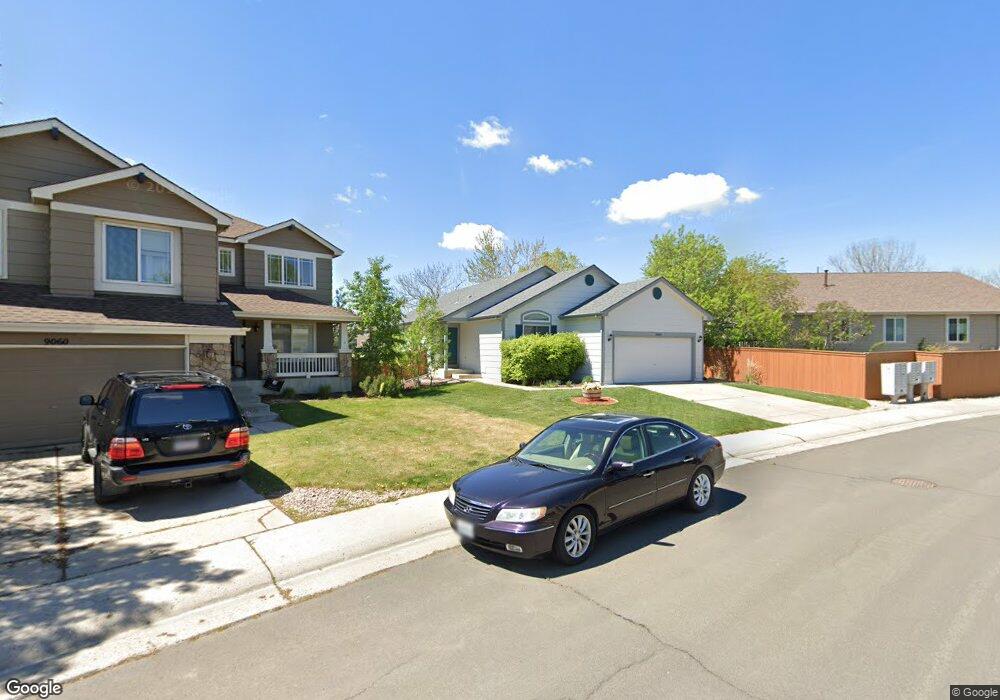
9064 Sanderling Way Littleton, CO 80126
Eastridge NeighborhoodEstimated Value: $614,783 - $700,000
3
Beds
2
Baths
1,372
Sq Ft
$473/Sq Ft
Est. Value
About This Home
This home is located at 9064 Sanderling Way, Littleton, CO 80126 and is currently estimated at $648,946, approximately $472 per square foot. 9064 Sanderling Way is a home located in Douglas County with nearby schools including Cougar Run Elementary School, Cresthill Middle School, and Highlands Ranch High School.
Ownership History
Date
Name
Owned For
Owner Type
Purchase Details
Closed on
May 8, 2002
Sold by
Nightengale Jeannette J
Bought by
Pennington Joseph A and Pennington Janis L
Current Estimated Value
Home Financials for this Owner
Home Financials are based on the most recent Mortgage that was taken out on this home.
Original Mortgage
$188,000
Outstanding Balance
$80,835
Interest Rate
7.19%
Estimated Equity
$568,111
Purchase Details
Closed on
Apr 22, 1998
Sold by
D R Horotn Inc
Bought by
Nightengale Jeannette J
Home Financials for this Owner
Home Financials are based on the most recent Mortgage that was taken out on this home.
Original Mortgage
$124,650
Interest Rate
7.09%
Purchase Details
Closed on
May 22, 1997
Sold by
Us Home Corp
Bought by
Dr Horton Inc
Create a Home Valuation Report for This Property
The Home Valuation Report is an in-depth analysis detailing your home's value as well as a comparison with similar homes in the area
Home Values in the Area
Average Home Value in this Area
Purchase History
| Date | Buyer | Sale Price | Title Company |
|---|---|---|---|
| Pennington Joseph A | $235,000 | Title Services | |
| Nightengale Jeannette J | $155,819 | North American Title Co | |
| Dr Horton Inc | $454,300 | -- |
Source: Public Records
Mortgage History
| Date | Status | Borrower | Loan Amount |
|---|---|---|---|
| Open | Pennington Joseph A | $188,000 | |
| Previous Owner | Nightengale Jeannette J | $124,650 | |
| Closed | Pennington Joseph A | $31,500 |
Source: Public Records
Tax History Compared to Growth
Tax History
| Year | Tax Paid | Tax Assessment Tax Assessment Total Assessment is a certain percentage of the fair market value that is determined by local assessors to be the total taxable value of land and additions on the property. | Land | Improvement |
|---|---|---|---|---|
| 2024 | $4,430 | $46,230 | $10,470 | $35,760 |
| 2023 | $4,471 | $46,230 | $10,470 | $35,760 |
| 2022 | $3,389 | $33,430 | $7,160 | $26,270 |
| 2021 | $3,521 | $33,430 | $7,160 | $26,270 |
| 2020 | $3,121 | $30,380 | $7,470 | $22,910 |
| 2019 | $3,131 | $31,480 | $7,470 | $24,010 |
| 2018 | $2,626 | $27,070 | $6,550 | $20,520 |
| 2017 | $2,621 | $28,210 | $6,550 | $21,660 |
| 2016 | $2,570 | $26,040 | $6,030 | $20,010 |
| 2015 | $2,617 | $26,040 | $6,030 | $20,010 |
| 2014 | $2,401 | $22,510 | $5,490 | $17,020 |
Source: Public Records
Map
Nearby Homes
- 8925 Copeland St
- 8951 Greenwich St
- 8909 Copeland St
- 8846 Pochard St
- 8861 Greenwich St
- 5126 Tuscany Ct
- 8734 Pochard St
- 6 Abernathy Ct
- 9323 Weeping Willow Place
- 5418 Shetland Ct
- 5329 Morning Glory Place
- 16 Shetland Ct
- 4605 Copeland Loop Unit 204
- 4605 Copeland Loop Unit 104
- 3970 White Bay Dr
- 41 Canongate Ln
- 9222 Buttonhill Ct
- 4758 Adelaide Place
- 9452 Loggia St Unit C
- 8495 Pebble Creek Way Unit 102
- 9060 Sanderling Way
- 9093 Goosander Way
- 9056 Sanderling Way
- 9089 Goosander Way
- 9061 Sanderling Way
- 9055 Sanderling Way
- 9050 Sanderling Way
- 9067 Sanderling Way
- 9079 Goosander Way
- 9049 Sanderling Way
- 9046 Sanderling Way
- 9071 Sanderling Way
- 9043 Sanderling Way
- 9098 Goosander Way
- 9073 Goosander Way
- 9088 Goosander Way
- 4728 Rock Pipit Ct
- 9040 Sanderling Way
- 9075 Sanderling Way
- 9039 Sanderling Way