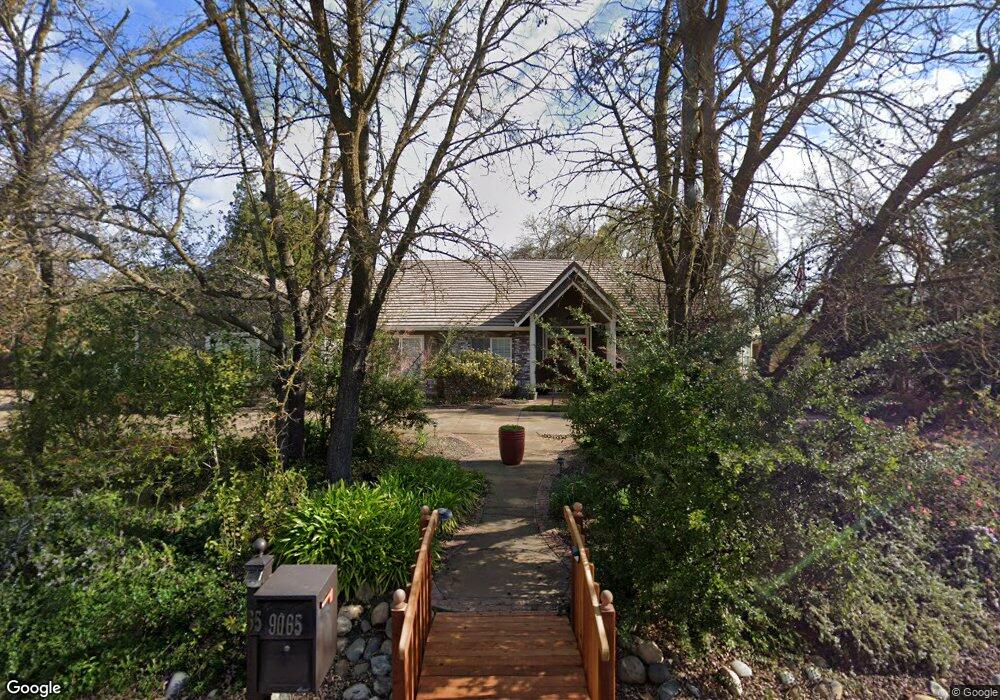
9065 Rancho Dr Elk Grove, CA 95624
North East Elk Grove NeighborhoodEstimated Value: $540,000 - $1,227,000
6
Beds
3
Baths
3,127
Sq Ft
$301/Sq Ft
Est. Value
About This Home
This home is located at 9065 Rancho Dr, Elk Grove, CA 95624 and is currently estimated at $942,158, approximately $301 per square foot. 9065 Rancho Dr is a home located in Sacramento County with nearby schools including Elk Grove Elementary School, Joseph Kerr Middle School, and Elk Grove High School.
Ownership History
Date
Name
Owned For
Owner Type
Purchase Details
Closed on
Jan 19, 2006
Sold by
Hargis Michael J and Hargis Nancy Ann
Bought by
Easley Glenn C and Easley Evelyn K
Current Estimated Value
Purchase Details
Closed on
Mar 29, 1999
Sold by
Hargis Michael and Hargis Nancy
Bought by
Hargis Michael J and Hargis Nancy Ann
Home Financials for this Owner
Home Financials are based on the most recent Mortgage that was taken out on this home.
Original Mortgage
$110,000
Interest Rate
6.73%
Mortgage Type
Seller Take Back
Purchase Details
Closed on
Mar 26, 1999
Sold by
Lansford Jack L and Lansford Billie
Bought by
Hargis Michael and Hargis Nancy
Home Financials for this Owner
Home Financials are based on the most recent Mortgage that was taken out on this home.
Original Mortgage
$110,000
Interest Rate
6.73%
Mortgage Type
Seller Take Back
Purchase Details
Closed on
Dec 2, 1996
Sold by
Pacific Trust Company
Bought by
Lansford Jack L and Lansford Billie
Create a Home Valuation Report for This Property
The Home Valuation Report is an in-depth analysis detailing your home's value as well as a comparison with similar homes in the area
Home Values in the Area
Average Home Value in this Area
Purchase History
| Date | Buyer | Sale Price | Title Company |
|---|---|---|---|
| Easley Glenn C | $969,500 | Fidelity National Title Co | |
| Hargis Michael J | -- | Fidelity National Title Co | |
| Hargis Michael | $110,000 | Fidelity National Title Co | |
| Lansford Jack L | $125,000 | Fidelity National Title Co |
Source: Public Records
Mortgage History
| Date | Status | Borrower | Loan Amount |
|---|---|---|---|
| Previous Owner | Hargis Michael | $110,000 | |
| Closed | Hargis Michael | $250,000 |
Source: Public Records
Tax History Compared to Growth
Tax History
| Year | Tax Paid | Tax Assessment Tax Assessment Total Assessment is a certain percentage of the fair market value that is determined by local assessors to be the total taxable value of land and additions on the property. | Land | Improvement |
|---|---|---|---|---|
| 2025 | $4,671 | $432,657 | $174,884 | $257,773 |
| 2024 | $4,671 | $424,174 | $171,455 | $252,719 |
| 2023 | $4,551 | $415,858 | $168,094 | $247,764 |
| 2022 | $4,466 | $407,705 | $164,799 | $242,906 |
| 2021 | $4,408 | $399,712 | $161,568 | $238,144 |
| 2020 | $4,347 | $395,615 | $159,912 | $235,703 |
| 2019 | $4,265 | $387,859 | $156,777 | $231,082 |
| 2018 | $4,148 | $380,254 | $153,703 | $226,551 |
| 2017 | $4,073 | $372,799 | $150,690 | $222,109 |
| 2016 | $3,864 | $365,490 | $147,736 | $217,754 |
| 2015 | $3,790 | $360,001 | $145,517 | $214,484 |
| 2014 | $3,726 | $352,950 | $142,667 | $210,283 |
Source: Public Records
Map
Nearby Homes
- 9113 Buckskin Ct
- 9430 2nd Ave
- 9497 Sara St
- 9244 Rancho Dr
- 9220 Cupertino Dr
- 8896 Kelsey Dr
- 9407 Aizenberg Cir
- 9467 Monte Cresta Way
- 9219 Crowell Dr
- 8865 Halverson Dr
- 9648 La Nuez Dr
- 9204 Summer Pond Ct
- 9271 Elk Grove Blvd
- 8804 On Ct
- 9011 Quail Cove Dr
- 9146 Quail Brook Cir
- 9112 Quail Terrace Way
- 8955 El Mirador Dr Unit 3
- 8770 Superb Cir
- 9018 El Oro Plaza Dr
- 9077 Rancho Dr
- 9059 Rancho Dr
- 9076 Rancho Dr
- 9064 Rancho Dr
- 9070 Rancho Dr
- 9082 Rancho Dr
- 9089 Rancho Dr
- 9053 Rancho Dr
- 9046 Rancho Dr
- 9417 Laguna Creek Dr
- 9088 Rancho Dr
- 9075 Clydesdale Ct
- 9421 Laguna Creek Dr
- 9040 Rancho Dr
- 9101 Rancho Dr
- 9079 Clydesdale Ct
- 9047 Rancho Dr
- 9425 Laguna Creek Dr
- 9041 Rancho Dr
- 9083 Clydesdale Ct