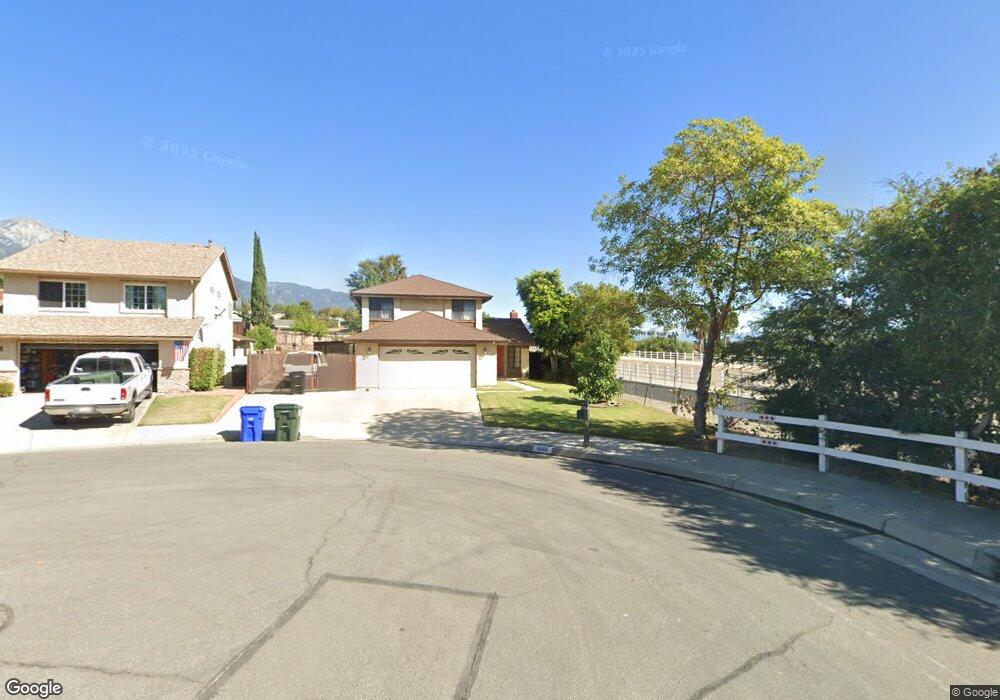
9066 Yew St Rancho Cucamonga, CA 91730
Estimated Value: $665,000 - $793,194
4
Beds
3
Baths
1,630
Sq Ft
$450/Sq Ft
Est. Value
About This Home
This home is located at 9066 Yew St, Rancho Cucamonga, CA 91730 and is currently estimated at $733,299, approximately $449 per square foot. 9066 Yew St is a home located in San Bernardino County with nearby schools including Valle Vista Elementary, Cucamonga Middle, and Alta Loma High.
Ownership History
Date
Name
Owned For
Owner Type
Purchase Details
Closed on
Feb 22, 2017
Sold by
Olsen Christopher Matthew
Bought by
Olsen Christina Marie and Olsen Christopher Matthew
Current Estimated Value
Purchase Details
Closed on
Jan 21, 2014
Sold by
Olsen Christina M
Bought by
Olsen Christopher Matthew and Olsen Brian Nicholas
Purchase Details
Closed on
Jan 7, 2009
Sold by
Olsen Earl L
Bought by
Olsen Christina M
Create a Home Valuation Report for This Property
The Home Valuation Report is an in-depth analysis detailing your home's value as well as a comparison with similar homes in the area
Home Values in the Area
Average Home Value in this Area
Purchase History
| Date | Buyer | Sale Price | Title Company |
|---|---|---|---|
| Olsen Christina Marie | -- | None Available | |
| Olsen Christopher Matthew | -- | None Available | |
| Olsen Christina M | -- | None Available |
Source: Public Records
Tax History Compared to Growth
Tax History
| Year | Tax Paid | Tax Assessment Tax Assessment Total Assessment is a certain percentage of the fair market value that is determined by local assessors to be the total taxable value of land and additions on the property. | Land | Improvement |
|---|---|---|---|---|
| 2025 | $2,853 | $267,496 | $84,989 | $182,507 |
| 2024 | $2,853 | $262,251 | $83,323 | $178,928 |
| 2023 | $2,790 | $257,109 | $81,689 | $175,420 |
| 2022 | $2,744 | $252,067 | $80,087 | $171,980 |
| 2021 | $2,742 | $247,125 | $78,517 | $168,608 |
| 2020 | $2,663 | $244,591 | $77,712 | $166,879 |
| 2019 | $2,649 | $239,795 | $76,188 | $163,607 |
| 2018 | $2,574 | $235,093 | $74,694 | $160,399 |
| 2017 | $2,604 | $230,483 | $73,229 | $157,254 |
| 2016 | $2,574 | $225,964 | $71,793 | $154,171 |
| 2015 | $2,546 | $222,570 | $70,715 | $151,855 |
| 2014 | $2,395 | $218,210 | $69,330 | $148,880 |
Source: Public Records
Map
Nearby Homes
- 8976 Yew St
- 7719 Vineyard Ave
- 7355 Vineyard Ave
- 9118 Baseline Rd
- 7906 Montara Ave
- 7730 Layton St
- 7534 Layton St
- 0 Camino Predera Unit OC25188933
- 0 Camino Predera Unit WS25184133
- 7236 Hellman Ave
- 7430 Leucite Ave
- 7795 Malachite Ave
- 8091 Camino Predera
- 9599 Church St
- 9340 Foothill Blvd Unit 68
- 9340 Foothill Blvd Unit 61
- 9340 Foothill Blvd
- 9056 La Vine St
- 8167 Vineyard Ave Unit 23
- 8167 Vineyard Ave Unit 38
- 9056 Yew St
- 9085 Candlewood St
- 9075 Candlewood St
- 9046 Yew St
- 9095 Candlewood St
- 9065 Candlewood St
- 9055 Candlewood St
- 9051 Yew St
- 9105 Candlewood St
- 9036 Yew St
- 7628 Pepper St
- 7618 Pepper St
- 7638 Pepper St
- 7608 Pepper St
- 9045 Candlewood St
- 9037 Yew St
- 7648 Pepper St
- 9109 Candlewood St
- 7598 Pepper St
- 9086 Candlewood St