Estimated Value: $449,000 - $621,000
4
Beds
3
Baths
2,003
Sq Ft
$287/Sq Ft
Est. Value
About This Home
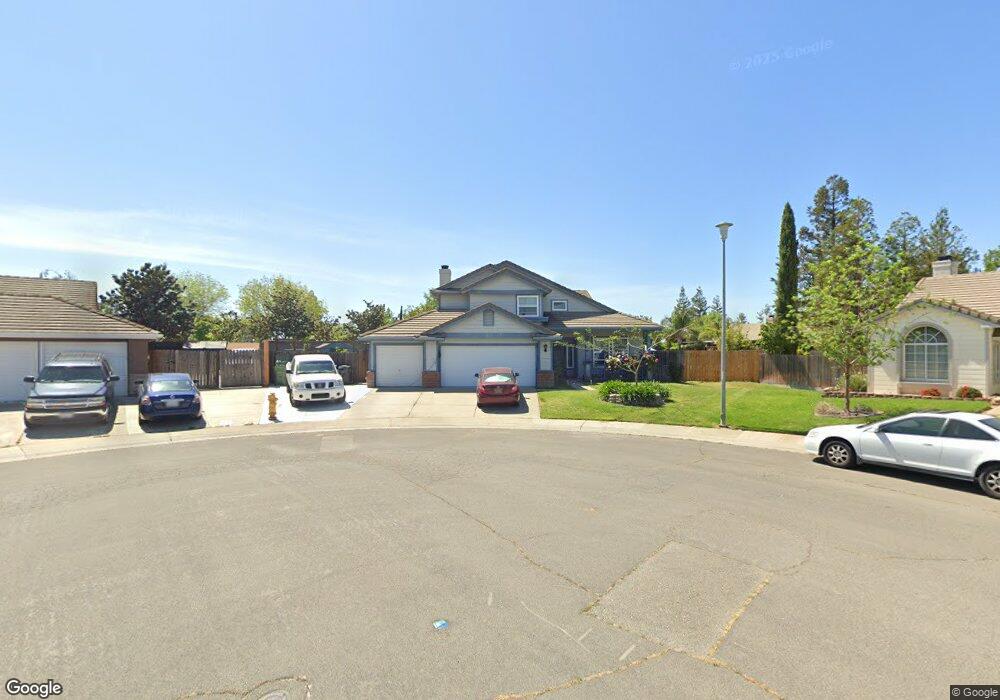
This home is located at 907 Courtenay Ct, Galt, CA 95632 and is currently estimated at $574,452, approximately $286 per square foot. 907 Courtenay Ct is a home located in Sacramento County with nearby schools including Marengo Ranch Elementary School, Robert L. McCaffrey Middle School, and Liberty Ranch High School.
Ownership History
Date
Name
Owned For
Owner Type
Purchase Details
Closed on
Oct 2, 2023
Sold by
Hockenson Kay
Bought by
Kay Hockenson 2023 Trust and Hockenson
Current Estimated Value
Purchase Details
Closed on
Dec 6, 2013
Sold by
Hockenson Warren
Bought by
Hockenson Kay
Purchase Details
Closed on
Jul 27, 1998
Sold by
Moncayo Jose and Moncayo Ernestina
Bought by
Hockenson Warren and Hockenson Kay
Home Financials for this Owner
Home Financials are based on the most recent Mortgage that was taken out on this home.
Original Mortgage
$152,900
Interest Rate
6.9%
Purchase Details
Closed on
Dec 1, 1993
Sold by
Morrison Homes
Bought by
Moncayo Jose and Moncayo Ernestina
Home Financials for this Owner
Home Financials are based on the most recent Mortgage that was taken out on this home.
Original Mortgage
$123,855
Interest Rate
6.89%
Create a Home Valuation Report for This Property
The Home Valuation Report is an in-depth analysis detailing your home's value as well as a comparison with similar homes in the area
Home Values in the Area
Average Home Value in this Area
Purchase History
| Date | Buyer | Sale Price | Title Company |
|---|---|---|---|
| Kay Hockenson 2023 Trust | -- | None Listed On Document | |
| Kay Hockenson 2023 Trust | -- | None Listed On Document | |
| Hockenson Kay | -- | None Available | |
| Hockenson Warren | $170,000 | Fidelity National Title Co | |
| Moncayo Jose | $181,500 | Chicago Title Company |
Source: Public Records
Mortgage History
| Date | Status | Borrower | Loan Amount |
|---|---|---|---|
| Previous Owner | Hockenson Warren | $152,900 | |
| Previous Owner | Moncayo Jose | $123,855 |
Source: Public Records
Tax History Compared to Growth
Tax History
| Year | Tax Paid | Tax Assessment Tax Assessment Total Assessment is a certain percentage of the fair market value that is determined by local assessors to be the total taxable value of land and additions on the property. | Land | Improvement |
|---|---|---|---|---|
| 2025 | $3,430 | $303,632 | $39,180 | $264,452 |
| 2024 | $3,430 | $297,679 | $38,412 | $259,267 |
| 2023 | $3,374 | $291,843 | $37,659 | $254,184 |
| 2022 | $3,721 | $286,121 | $36,921 | $249,200 |
| 2021 | $3,337 | $246,198 | $36,198 | $210,000 |
| 2020 | $3,314 | $243,674 | $35,827 | $207,847 |
| 2019 | $3,246 | $238,897 | $35,125 | $203,772 |
| 2018 | $3,241 | $234,214 | $34,437 | $199,777 |
| 2017 | $3,137 | $229,622 | $33,762 | $195,860 |
| 2016 | $3,062 | $225,120 | $33,100 | $192,020 |
| 2015 | $3,311 | $221,739 | $32,603 | $189,136 |
| 2014 | $3,317 | $217,397 | $31,965 | $185,432 |
Source: Public Records
Map
Nearby Homes
- 908 Wildbrook Ct
- 1054 Starbrook Dr
- 866 Golden Heights Dr
- 843 Lake Park Cir
- 829 Lake Park Cir
- 825 Lake Park Cir
- 821 Lake Park Cir
- 1156 Monique St
- 1160 Monique St
- Residence 1883 Plan at The Cottages at Greenwood
- 2012 Seraphina St
- Residence 2448 Plan at Summerfield - Cedar Grove at Summerfield
- Residence 2760 Plan at Summerfield - Cedar Glen at Summerfield
- 1173 Monique St
- Residence 3308 Plan at Summerfield - Cedar Glen at Summerfield
- 1164 Monique St
- Residence 2072 Plan at The Towns at Greenwood
- Residence 2788 Plan at Summerfield - Cedar Glen at Summerfield
- 1169 Monique St
- 2016 Seraphina St
- 911 Courtenay Ct
- 908 Courtenay Ct
- 900 Lake Canyon Ave
- 904 Lake Canyon Ave
- 915 Courtenay Ct
- 908 Lake Canyon Ave
- 912 Courtenay Ct
- 1058 Cedar Canyon Cir
- 912 Lake Canyon Ave
- 916 Courtenay Ct
- 1050 Cedar Canyon Cir
- 892 Lake Canyon Ave
- 919 Courtenay Ct
- 1042 Cedar Canyon Cir
- 907 Wildbrook Ct
- 893 Olive Canyon Dr
- 916 Lake Canyon Ave
- 920 Courtenay Ct
- 911 Wildbrook Ct
- 1034 Cedar Canyon Cir