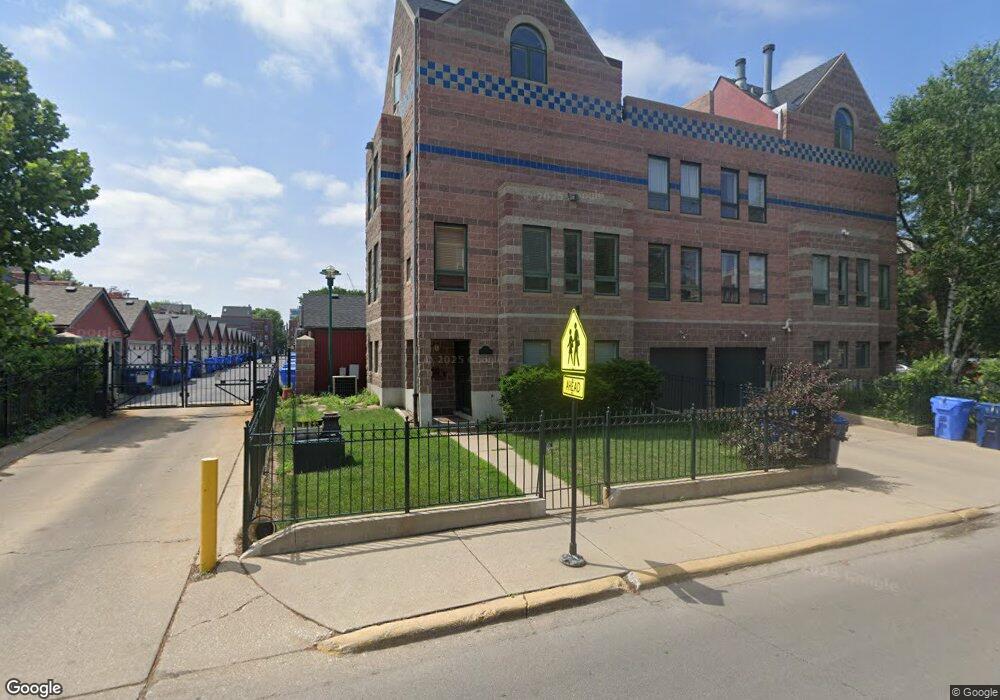
907 E 53rd St Chicago, IL 60615
Hyde Park NeighborhoodEstimated Value: $299,000 - $683,000
3
Beds
3
Baths
1,274
Sq Ft
$434/Sq Ft
Est. Value
About This Home
This home is located at 907 E 53rd St, Chicago, IL 60615 and is currently estimated at $553,519, approximately $434 per square foot. 907 E 53rd St is a home located in Cook County with nearby schools including Kozminski Community Academy, Kenwood Academy High School, and The Chicago Free School.
Ownership History
Date
Name
Owned For
Owner Type
Purchase Details
Closed on
Jun 29, 2017
Sold by
Echols Doonna Skinner and Echols James K
Bought by
White Yvonne
Current Estimated Value
Home Financials for this Owner
Home Financials are based on the most recent Mortgage that was taken out on this home.
Original Mortgage
$368,207
Outstanding Balance
$302,580
Interest Rate
3.5%
Mortgage Type
FHA
Estimated Equity
$250,939
Purchase Details
Closed on
Sep 19, 2001
Sold by
Maynard Jerome I and Maynard Margaret J
Bought by
Echols James K and Echols Donna S
Home Financials for this Owner
Home Financials are based on the most recent Mortgage that was taken out on this home.
Original Mortgage
$260,000
Interest Rate
6%
Purchase Details
Closed on
Sep 26, 1994
Sold by
American National Bk & Tr Co Of Chicago
Bought by
Maynard Jerome I and Maynard Margaret J
Home Financials for this Owner
Home Financials are based on the most recent Mortgage that was taken out on this home.
Original Mortgage
$265,300
Interest Rate
6.62%
Create a Home Valuation Report for This Property
The Home Valuation Report is an in-depth analysis detailing your home's value as well as a comparison with similar homes in the area
Home Values in the Area
Average Home Value in this Area
Purchase History
| Date | Buyer | Sale Price | Title Company |
|---|---|---|---|
| White Yvonne | $375,000 | Attorney | |
| Echols James K | $325,000 | Lawyers Title Insurance Corp | |
| Maynard Jerome I | $265,000 | -- |
Source: Public Records
Mortgage History
| Date | Status | Borrower | Loan Amount |
|---|---|---|---|
| Open | White Yvonne | $368,207 | |
| Previous Owner | Echols James K | $260,000 | |
| Previous Owner | Maynard Jerome I | $265,300 |
Source: Public Records
Tax History Compared to Growth
Tax History
| Year | Tax Paid | Tax Assessment Tax Assessment Total Assessment is a certain percentage of the fair market value that is determined by local assessors to be the total taxable value of land and additions on the property. | Land | Improvement |
|---|---|---|---|---|
| 2024 | $8,681 | $58,000 | $7,899 | $50,101 |
| 2023 | $8,433 | $41,000 | $6,370 | $34,630 |
| 2022 | $8,433 | $41,000 | $6,370 | $34,630 |
| 2021 | $8,245 | $41,000 | $6,370 | $34,630 |
| 2020 | $9,182 | $41,216 | $5,096 | $36,120 |
| 2019 | $9,001 | $44,800 | $5,096 | $39,704 |
| 2018 | $8,849 | $44,800 | $5,096 | $39,704 |
| 2017 | $7,362 | $37,572 | $4,204 | $33,368 |
| 2016 | $7,025 | $37,572 | $4,204 | $33,368 |
| 2015 | $6,404 | $37,572 | $4,204 | $33,368 |
| 2014 | $5,043 | $29,750 | $3,439 | $26,311 |
| 2013 | $4,933 | $29,750 | $3,439 | $26,311 |
Source: Public Records
Map
Nearby Homes
- 5252 S Drexel Ave Unit 3A
- 5239 S Ingleside Ave
- 5223 S Drexel Ave Unit 2N
- 1006 E 54th St Unit J-2
- 1000 E 53rd St Unit 119S
- 5200 S Ellis Ave Unit 202
- 5200 S Ellis Ave Unit 508
- 5132 S Drexel Ave Unit 2D
- 5459 S Ingleside Ave Unit 5459
- 5455 S Ingleside Ave Unit 5455
- 5118 S Ingleside Ave Unit A
- 5469 S Ingleside Ave Unit 2N
- 5107 S Ingleside Ave Unit 3
- 5230 S University Ave Unit D
- 945 E Hyde Park Blvd Unit 2
- 947 E Hyde Park Blvd Unit G
- 5133 S Greenwood Ave Unit 2
- 5142 S Greenwood Ave Unit 1
- 5229 S University Ave
- 1059 E Hyde Park Blvd Unit 1
- 5303 S Drexel Ave
- 5305 S Drexel Ave
- 915 E 53rd St
- 903 E 53rd St
- 5307 S Drexel Ave
- 5302 S Ingleside Ave
- 5309 S Drexel Ave
- 5304 S Ingleside Ave
- 5306 S Ingleside Ave
- 5311 S Drexel Ave
- 919 E 53rd St
- 5308 S Ingleside Ave
- 5313 S Drexel Ave
- 5310 S Ingleside Ave
- 5315 S Drexel Ave
- 5312 S Ingleside Ave
- 5317 S Drexel Ave
- 5314 S Ingleside Ave
- 5316 S Ingleside Ave
- 5319 S Drexel Ave