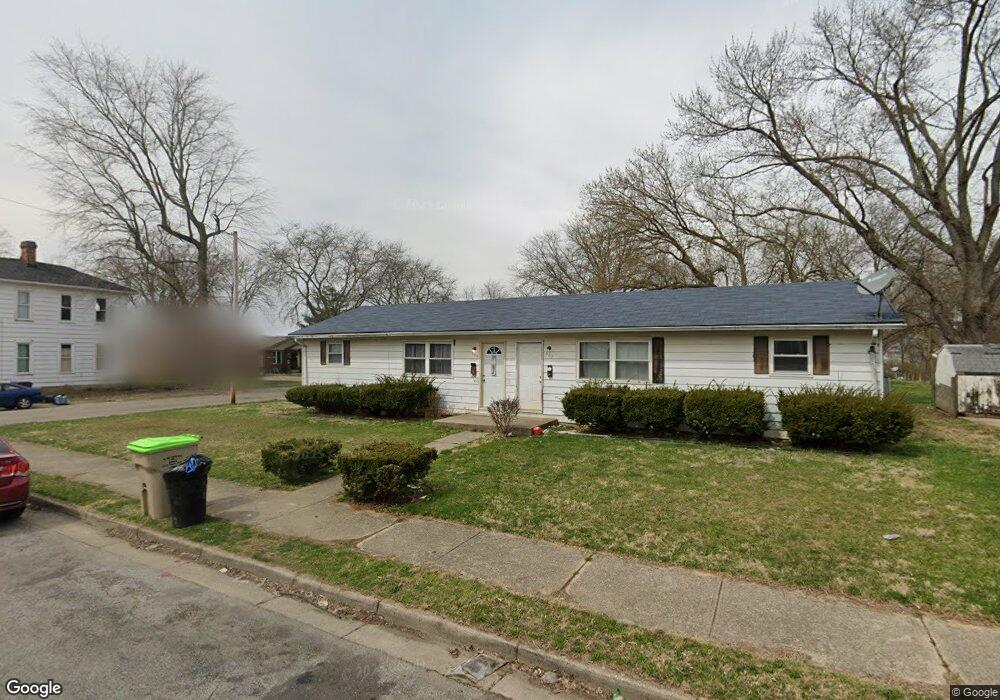
907 Elder St Unit 909 Springfield, OH 45505
Estimated Value: $54,000 - $123,000
4
Beds
2
Baths
1,440
Sq Ft
$67/Sq Ft
Est. Value
About This Home
This home is located at 907 Elder St Unit 909, Springfield, OH 45505 and is currently estimated at $95,949, approximately $66 per square foot. 907 Elder St Unit 909 is a home located in Clark County with nearby schools including Kenwood Elementary School, Hayward Middle School, and Springfield High School.
Ownership History
Date
Name
Owned For
Owner Type
Purchase Details
Closed on
Mar 17, 2021
Sold by
Jones Joe A
Bought by
Wilson Mike and Linton Rhonda Leann
Current Estimated Value
Home Financials for this Owner
Home Financials are based on the most recent Mortgage that was taken out on this home.
Original Mortgage
$40,500
Outstanding Balance
$39,111
Interest Rate
9.65%
Mortgage Type
Land Contract Argmt. Of Sale
Estimated Equity
$56,838
Purchase Details
Closed on
Sep 26, 2003
Sold by
Case Gary L
Bought by
Jones Joe A
Home Financials for this Owner
Home Financials are based on the most recent Mortgage that was taken out on this home.
Original Mortgage
$41,795
Interest Rate
6.33%
Mortgage Type
FHA
Create a Home Valuation Report for This Property
The Home Valuation Report is an in-depth analysis detailing your home's value as well as a comparison with similar homes in the area
Home Values in the Area
Average Home Value in this Area
Purchase History
| Date | Buyer | Sale Price | Title Company |
|---|---|---|---|
| Wilson Mike | $45,000 | None Available | |
| Jones Joe A | $41,600 | -- |
Source: Public Records
Mortgage History
| Date | Status | Borrower | Loan Amount |
|---|---|---|---|
| Open | Wilson Mike | $40,500 | |
| Closed | Jones Joe A | $41,795 |
Source: Public Records
Tax History
| Year | Tax Paid | Tax Assessment Tax Assessment Total Assessment is a certain percentage of the fair market value that is determined by local assessors to be the total taxable value of land and additions on the property. | Land | Improvement |
|---|---|---|---|---|
| 2025 | $1,136 | $33,030 | $4,230 | $28,800 |
| 2024 | $1,107 | $22,420 | $3,320 | $19,100 |
| 2023 | $1,107 | $22,420 | $3,320 | $19,100 |
| 2022 | $1,135 | $22,420 | $3,320 | $19,100 |
| 2021 | $1,120 | $20,380 | $3,020 | $17,360 |
| 2020 | $1,122 | $20,380 | $3,020 | $17,360 |
| 2019 | $1,125 | $20,380 | $3,020 | $17,360 |
| 2018 | $1,120 | $19,480 | $2,520 | $16,960 |
| 2017 | $1,120 | $19,478 | $2,517 | $16,961 |
| 2016 | $1,121 | $19,478 | $2,517 | $16,961 |
| 2015 | $1,143 | $19,478 | $2,517 | $16,961 |
| 2014 | $1,138 | $19,478 | $2,517 | $16,961 |
| 2013 | $1,126 | $19,478 | $2,517 | $16,961 |
Source: Public Records
Map
Nearby Homes
- 920 Oak St
- 908 Pine St
- 453 E Pleasant St
- 1111 Lafayette Ave
- 718 Summer St
- 652 E Southern Ave
- 705 York St
- 1008 Tibbetts Ave
- 900 E Rose St
- 625 Tibbetts Ave
- 1065 Mound St Unit 1067
- 441 E Euclid Ave
- 360 S Greenmount Ave
- 550 E Rose St
- 1440 Selma Rd
- 1215 E High St
- 1609 Irwin Ave
- 321 Glenn Ave
- 315 Glenn Ave
- 1652 Kenton St
- 901 Elder St
- 865 Elder St
- 1029 -1031 Buckeye St
- 1029 Buckeye St Unit 1031
- 861 Elder St
- 918 Elder St
- 914 Elder St
- 916 Elder St
- 1010 Elder St
- 1012 Elder St Unit 1014
- 859 Elder St
- 910 Elder St
- 1027 Summer St Unit 1029
- 1031 Summer St
- 1022 Elder St
- 1019 Summer St
- 1017 Summer St
- 908 Elder St
- 1015 Summer St
- 834 Cypress St
Your Personal Tour Guide
Ask me questions while you tour the home.