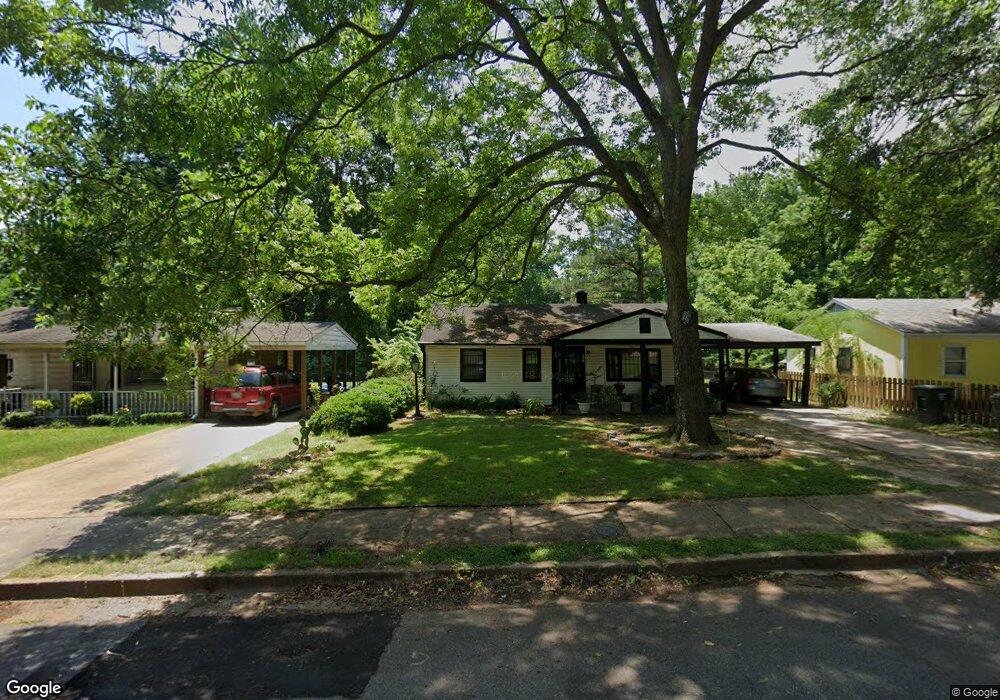
907 Par Ave Memphis, TN 38127
Frayser NeighborhoodEstimated Value: $84,000 - $96,000
2
Beds
1
Bath
1,295
Sq Ft
$69/Sq Ft
Est. Value
About This Home
This home is located at 907 Par Ave, Memphis, TN 38127 and is currently estimated at $88,739, approximately $68 per square foot. 907 Par Ave is a home located in Shelby County with nearby schools including Westside Elementary School, Trezevant High School, and Compass Community School Frayser Campus.
Ownership History
Date
Name
Owned For
Owner Type
Purchase Details
Closed on
Nov 21, 2002
Sold by
Moore Charles E
Bought by
Fields Joseph
Current Estimated Value
Home Financials for this Owner
Home Financials are based on the most recent Mortgage that was taken out on this home.
Original Mortgage
$46,750
Outstanding Balance
$25,898
Interest Rate
10.6%
Estimated Equity
$62,841
Purchase Details
Closed on
Apr 26, 2000
Sold by
Thigpen Ruth Ann and Thigpen Steven Lee
Bought by
Moore Charles E
Create a Home Valuation Report for This Property
The Home Valuation Report is an in-depth analysis detailing your home's value as well as a comparison with similar homes in the area
Home Values in the Area
Average Home Value in this Area
Purchase History
| Date | Buyer | Sale Price | Title Company |
|---|---|---|---|
| Fields Joseph | $55,000 | First American Title Ins Co | |
| Moore Charles E | $18,000 | -- |
Source: Public Records
Mortgage History
| Date | Status | Borrower | Loan Amount |
|---|---|---|---|
| Open | Fields Joseph | $46,750 |
Source: Public Records
Tax History Compared to Growth
Tax History
| Year | Tax Paid | Tax Assessment Tax Assessment Total Assessment is a certain percentage of the fair market value that is determined by local assessors to be the total taxable value of land and additions on the property. | Land | Improvement |
|---|---|---|---|---|
| 2025 | $426 | $18,975 | $1,625 | $17,350 |
| 2024 | $426 | $12,575 | $1,275 | $11,300 |
| 2023 | $766 | $12,575 | $1,275 | $11,300 |
| 2022 | $766 | $12,575 | $1,275 | $11,300 |
| 2021 | $775 | $12,575 | $1,275 | $11,300 |
| 2020 | $601 | $8,300 | $1,275 | $7,025 |
| 2019 | $601 | $8,300 | $1,275 | $7,025 |
| 2018 | $601 | $8,300 | $1,275 | $7,025 |
| 2017 | $341 | $8,300 | $1,275 | $7,025 |
| 2016 | $436 | $9,975 | $0 | $0 |
| 2014 | $436 | $9,975 | $0 | $0 |
Source: Public Records
Map
Nearby Homes