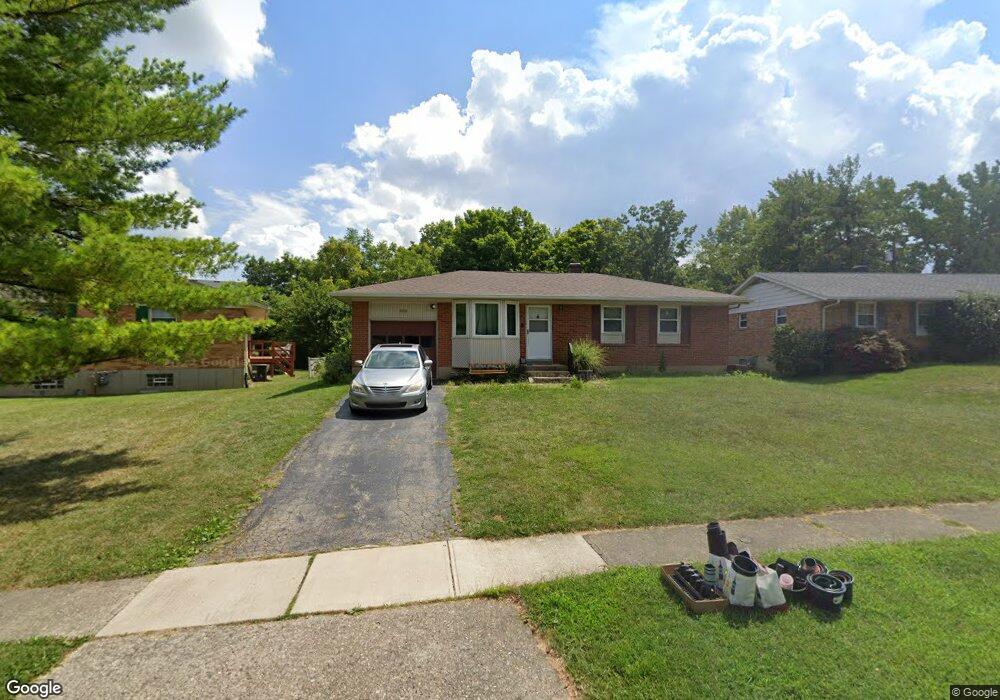
9072 Tag Dr Cincinnati, OH 45231
Estimated Value: $226,000 - $241,000
3
Beds
2
Baths
1,913
Sq Ft
$121/Sq Ft
Est. Value
About This Home
This home is located at 9072 Tag Dr, Cincinnati, OH 45231 and is currently estimated at $231,623, approximately $121 per square foot. 9072 Tag Dr is a home located in Hamilton County with nearby schools including Mt Healthy High School, Central Montessori Academy, and Our Lady of Grace Catholic School.
Ownership History
Date
Name
Owned For
Owner Type
Purchase Details
Closed on
Oct 23, 2020
Sold by
Carter Nicole Adelle and Chenault Michael W
Bought by
Chenault Michael W and Chenault Nicole
Current Estimated Value
Purchase Details
Closed on
Jul 11, 2011
Sold by
Neiman Mae E
Bought by
Carter Nicole Adelle
Home Financials for this Owner
Home Financials are based on the most recent Mortgage that was taken out on this home.
Original Mortgage
$74,375
Outstanding Balance
$51,144
Interest Rate
4.5%
Mortgage Type
FHA
Estimated Equity
$180,479
Purchase Details
Closed on
Apr 8, 2004
Sold by
Neiman Winfield N and Neiman Mae E
Bought by
Neiman Winfield Norman and Neiman Mae E
Purchase Details
Closed on
Oct 15, 1993
Sold by
Wilson Gregory C and Wilson Jamie C
Bought by
Neiman Winfield N and Neiman Mae E
Create a Home Valuation Report for This Property
The Home Valuation Report is an in-depth analysis detailing your home's value as well as a comparison with similar homes in the area
Home Values in the Area
Average Home Value in this Area
Purchase History
| Date | Buyer | Sale Price | Title Company |
|---|---|---|---|
| Chenault Michael W | -- | Absolute Title Agency Llc | |
| Carter Nicole Adelle | $62,900 | Fidelity Land Title Agency | |
| Neiman Winfield Norman | -- | -- | |
| Neiman Winfield N | -- | -- |
Source: Public Records
Mortgage History
| Date | Status | Borrower | Loan Amount |
|---|---|---|---|
| Open | Carter Nicole Adelle | $74,375 |
Source: Public Records
Tax History Compared to Growth
Tax History
| Year | Tax Paid | Tax Assessment Tax Assessment Total Assessment is a certain percentage of the fair market value that is determined by local assessors to be the total taxable value of land and additions on the property. | Land | Improvement |
|---|---|---|---|---|
| 2024 | $3,171 | $54,958 | $9,300 | $45,658 |
| 2023 | $3,012 | $54,958 | $9,300 | $45,658 |
| 2022 | $2,772 | $36,407 | $8,778 | $27,629 |
| 2021 | $2,698 | $36,407 | $8,778 | $27,629 |
| 2020 | $2,738 | $36,407 | $8,778 | $27,629 |
| 2019 | $2,483 | $30,853 | $7,438 | $23,415 |
| 2018 | $2,497 | $30,853 | $7,438 | $23,415 |
| 2017 | $2,369 | $30,853 | $7,438 | $23,415 |
| 2016 | $1,464 | $18,715 | $7,438 | $11,277 |
| 2015 | $1,475 | $18,715 | $7,438 | $11,277 |
| 2014 | $1,468 | $18,715 | $7,438 | $11,277 |
| 2013 | $1,689 | $22,015 | $8,750 | $13,265 |
Source: Public Records
Map
Nearby Homes
- 9124 Ranchill Dr
- 2358 Woodbluff Ct
- 7428 Werner Ave
- 1737 Compton Rd
- 2317 Garrison Dr
- 7355 Werner Ave
- 7212 Park Ave
- 8729 Morningstar Ln
- 2204 Woodacre Dr
- 8721 Moonlight Dr
- 8707 Moonlight Ln
- 9648 Fallshill Cir
- 8784 Pippin Rd
- 9453 Coogan Dr
- 9224 Comstock Dr
- 9329 Comstock Dr
- 1842 Centerridge Ave
- 2664 Chopin Dr
- 2317 Magdalena Dr
- 2714 Compton Rd