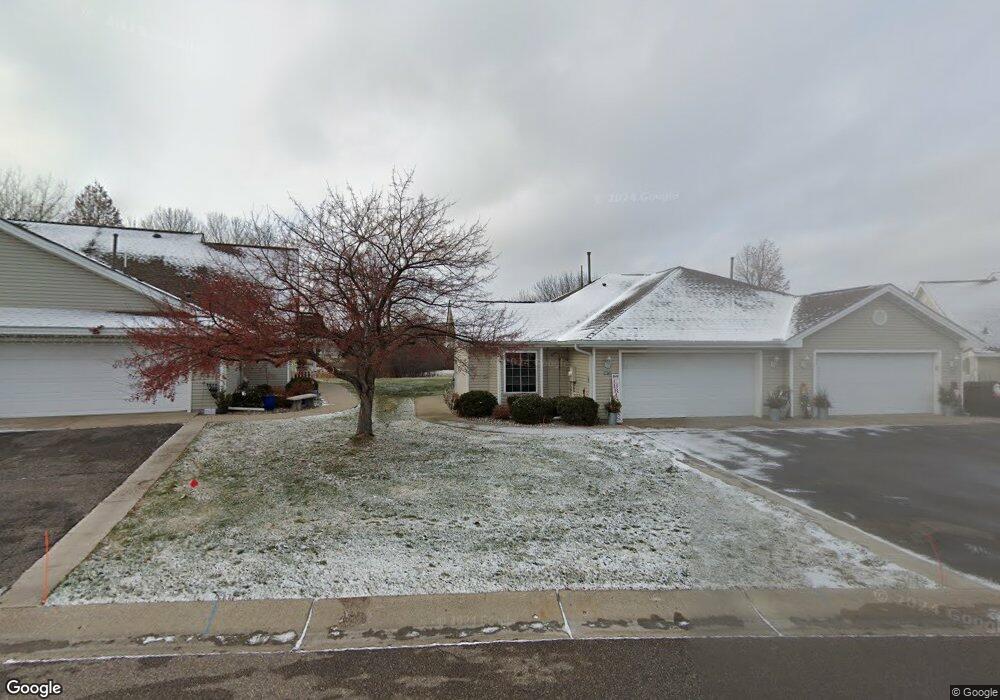
9073 Underwood Ln N Maple Grove, MN 55369
Estimated Value: $251,000 - $520,326
2
Beds
1
Bath
1,148
Sq Ft
$313/Sq Ft
Est. Value
About This Home
This home is located at 9073 Underwood Ln N, Maple Grove, MN 55369 and is currently estimated at $359,832, approximately $313 per square foot. 9073 Underwood Ln N is a home located in Hennepin County with nearby schools including Rice Lake Elementary School, Osseo Middle School, and Maple Grove Senior High School.
Ownership History
Date
Name
Owned For
Owner Type
Purchase Details
Closed on
Jan 15, 2021
Sold by
M I Homes Of Minneapolis St Paul Llc
Bought by
Caye Elizabeth P and Beahen Marcia L
Current Estimated Value
Home Financials for this Owner
Home Financials are based on the most recent Mortgage that was taken out on this home.
Original Mortgage
$164,600
Outstanding Balance
$146,906
Interest Rate
2.71%
Mortgage Type
New Conventional
Estimated Equity
$212,926
Purchase Details
Closed on
May 31, 2017
Sold by
Sutton Joshua and Sutton Heidi Miller
Bought by
Gates Thomas M and Gates Carole A
Home Financials for this Owner
Home Financials are based on the most recent Mortgage that was taken out on this home.
Original Mortgage
$160,047
Interest Rate
4.12%
Mortgage Type
FHA
Purchase Details
Closed on
Feb 23, 2001
Sold by
City Of Maple Grove
Bought by
Miller Heidi Jo
Create a Home Valuation Report for This Property
The Home Valuation Report is an in-depth analysis detailing your home's value as well as a comparison with similar homes in the area
Home Values in the Area
Average Home Value in this Area
Purchase History
| Date | Buyer | Sale Price | Title Company |
|---|---|---|---|
| Caye Elizabeth P | $484,054 | Transohio Res Title | |
| Gates Thomas M | $163,000 | Edina Realty Title Inc | |
| Miller Heidi Jo | $134,000 | -- |
Source: Public Records
Mortgage History
| Date | Status | Borrower | Loan Amount |
|---|---|---|---|
| Open | Caye Elizabeth P | $164,600 | |
| Previous Owner | Gates Thomas M | $160,047 |
Source: Public Records
Tax History Compared to Growth
Tax History
| Year | Tax Paid | Tax Assessment Tax Assessment Total Assessment is a certain percentage of the fair market value that is determined by local assessors to be the total taxable value of land and additions on the property. | Land | Improvement |
|---|---|---|---|---|
| 2024 | $3,295 | $287,500 | $66,200 | $221,300 |
| 2023 | $3,361 | $295,000 | $81,200 | $213,800 |
| 2022 | $2,649 | $262,100 | $76,200 | $185,900 |
| 2021 | $2,505 | $231,800 | $76,200 | $155,600 |
| 2020 | $2,248 | $217,300 | $71,200 | $146,100 |
| 2019 | $2,139 | $189,200 | $45,000 | $144,200 |
| 2018 | $1,854 | $172,700 | $45,000 | $127,700 |
| 2017 | $2,089 | $142,600 | $47,500 | $95,100 |
| 2016 | $2,242 | $150,900 | $49,000 | $101,900 |
| 2015 | $1,985 | $130,000 | $39,000 | $91,000 |
| 2014 | -- | $123,200 | $39,000 | $84,200 |
Source: Public Records
Map
Nearby Homes
- 9061 Underwood Ln N
- 13351 90th Place N
- 8983 Vinewood Ln N
- 9222 92nd Cir N
- 9252 Zinnia Ln N
- 13590 89th Ave N
- 13744 94th Ave N
- 12769 88th Ave N
- 9491 Rosewood Ln N
- 12487 93rd Ave N
- 9323 Magnolia Ln N
- 8887 Dallas Ln N
- 12509 88th Ave N
- 12401 94th Ave N
- 14291 92nd Ave N
- 14060 87th Ave N
- 9323 Kirkwood Ln N
- 9421 Dallas Ln N
- 9311 Kirkwood Ln N
- 14350 92nd Ave N
- 9067 Underwood Ln N
- 9079 Underwood Ln N
- 9085 Underwood Ln N
- 9091 Underwood Ln N
- 9072 Underwood Ln N
- 13244 90th Place N Unit 13244
- 13242 90th Place N
- 13238 90th Place N
- 9097 Underwood Ln N
- 9068 Underwood Ln N
- 13236 90th Place N Unit 13236
- 13234 90th Place N Unit 13234
- 13230 90th Place N
- 13240 90th Place N Unit 13240
- 9080 Underwood Ln N
- 9103 Underwood Ln N
- 9086 Underwood Ln N
- 9098 Underwood Ln N
- 13162 90th Place N
- 13160 90th Place N