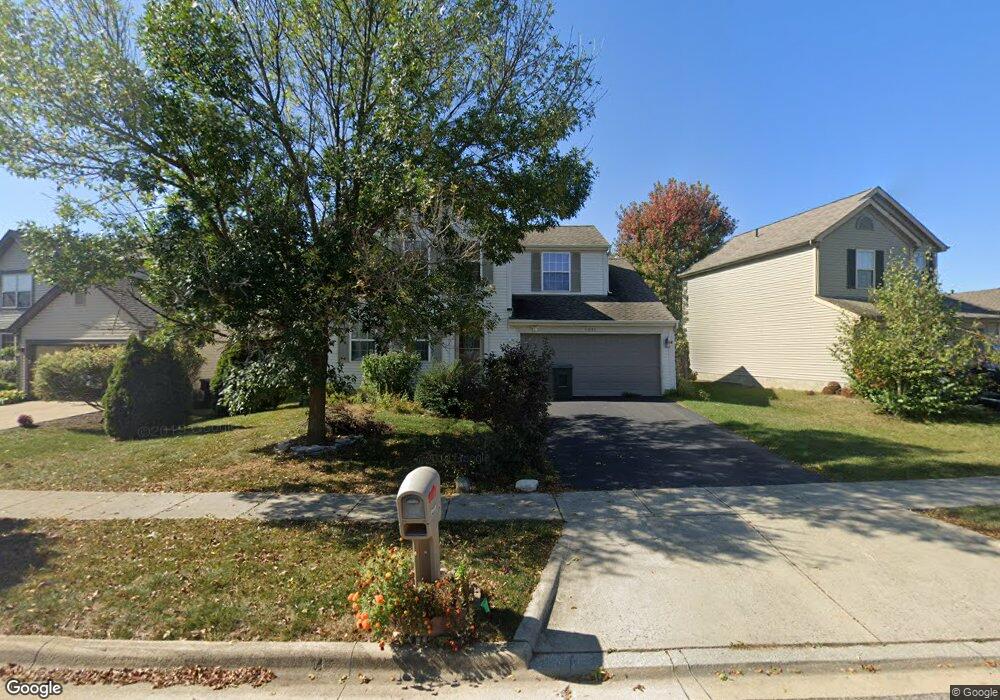
9079 Tabernash Dr Columbus, OH 43240
Polaris North NeighborhoodEstimated Value: $441,000 - $457,000
About This Home
This home is located at 9079 Tabernash Dr, Columbus, OH 43240 and is currently estimated at $448,032, approximately $230 per square foot. 9079 Tabernash Dr is a home located in Delaware County with nearby schools including Oak Creek Elementary School, Olentangy Orange Middle School, and Orange High School.
Ownership History
We collect this data history from publicly available records. To have your information removed, we recommend requesting removal directly through your county’s website.
Purchase Details
Home Financials for this Owner
Home Financials are based on the most recent Mortgage that was taken out on this home.Purchase Details
Purchase Details
Home Financials for this Owner
Home Financials are based on the most recent Mortgage that was taken out on this home.Home Values in the Area
Average Home Value in this Area
Purchase History
We collect this data history from publicly available records. To have your information removed, we recommend requesting removal directly through your county’s website.
| Date | Buyer | Sale Price | Title Company |
|---|---|---|---|
| $24,000 | Land & Mortgage Title | ||
| -- | Charter Title Agency | ||
| $166,810 | -- |
Mortgage History
We collect this data history from publicly available records. To have your information removed, we recommend requesting removal directly through your county’s website.
| Date | Status | Borrower | Loan Amount |
|---|---|---|---|
| Open | $217,920 | ||
| Closed | $166,318 |
Tax History
We collect this data history from publicly available records. To have your information removed, we recommend requesting removal directly through your county’s website.
| Year | Tax Paid | Tax Assessment Tax Assessment Total Assessment is a certain percentage of the fair market value that is determined by local assessors to be the total taxable value of land and additions on the property. | Land | Improvement |
|---|---|---|---|---|
| 2025 | $6,058 | $123,340 | $26,600 | $96,740 |
| 2024 | $5,999 | $123,340 | $26,600 | $96,740 |
| 2023 | $6,025 | $123,340 | $26,600 | $96,740 |
| 2022 | $5,484 | $89,400 | $17,330 | $72,070 |
| 2021 | $5,686 | $89,400 | $17,330 | $72,070 |
| 2020 | $5,546 | $89,400 | $17,330 | $72,070 |
| 2019 | $4,460 | $75,810 | $15,750 | $60,060 |
| 2018 | $4,480 | $75,810 | $15,750 | $60,060 |
| 2017 | $4,427 | $67,310 | $14,000 | $53,310 |
| 2016 | $4,220 | $67,310 | $14,000 | $53,310 |
| 2015 | $3,787 | $67,310 | $14,000 | $53,310 |
| 2014 | $3,843 | $67,310 | $14,000 | $53,310 |
| 2013 | $3,930 | $67,310 | $14,000 | $53,310 |
Map
- 1274 Allington Ln Unit 1274
- 9184 Misty Dawn Dr
- 1286 Allington Ln Unit 1286
- 9069 Polaris Lakes Dr Unit 9069
- 1746 E Powell Rd
- 924 Chara Ln Unit 10924
- 2447 Tucker Trail
- 2449 Minnie Ct
- 9213 Prestwick Green Dr
- 2121 Tucker Trail
- 1465 Cottonwood Dr
- 9275 Polaris Green Dr
- 1923 Myrtle St
- 9074 Longstone Dr
- 736 Sanville Dr
- 2051 Maxwell Ave
- 9325 Cliff Springs Trail
- 664 Arden St
- 9133 Longstone Dr
- 1108 Little Bear Dr
- 9073 Tabernash Dr
- 9085 Tabernash Dr
- 9097 Tabernash Dr
- 1225 Pebble Brook Dr
- 1186 Cathoway Ct
- 1202 Cathoway Ct
- 1194 Cathoway Ct
- 9078 Tabernash Dr
- 9072 Tabernash Dr
- 1217 Pebble Brook Dr
- 1178 Cathoway Ct
- 9066 Tabernash Dr
- 9084 Tabernash Dr
- 9060 Tabernash Dr
- 9090 Tabernash Dr
- 9096 Tabernash Dr
- 9054 Tabernash Dr
- 1201 Pebble Brook Dr
- 1224 Pebble Brook Dr
- 1170 Cathoway Ct
Ask me questions while you tour the home.