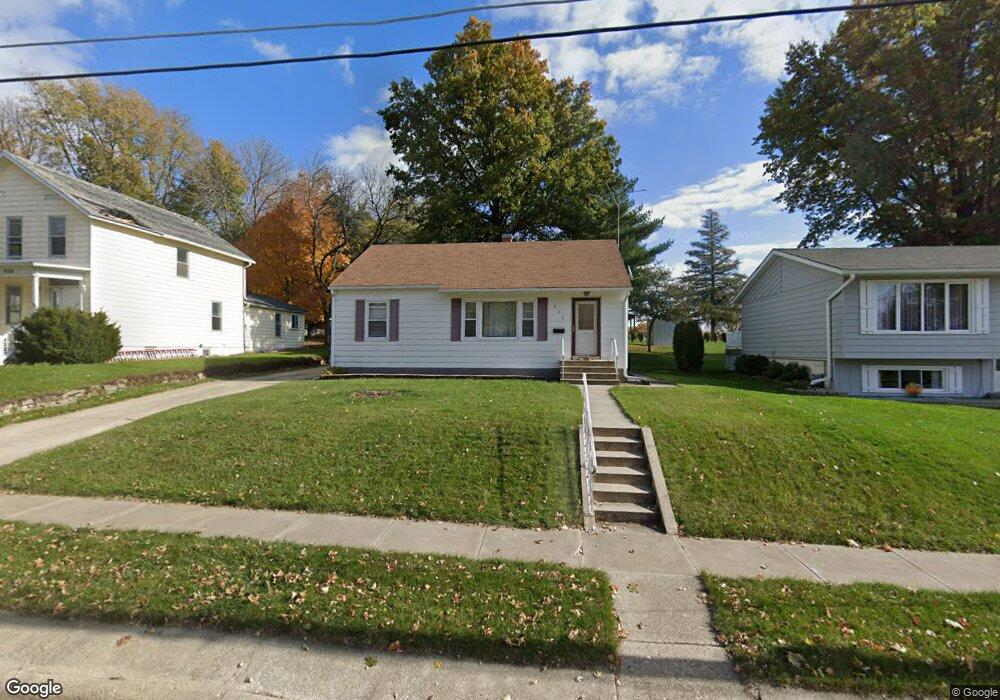
908 11th St Grundy Center, IA 50638
Estimated Value: $126,000 - $148,000
2
Beds
2
Baths
884
Sq Ft
$153/Sq Ft
Est. Value
About This Home
This home is located at 908 11th St, Grundy Center, IA 50638 and is currently estimated at $135,547, approximately $153 per square foot. 908 11th St is a home with nearby schools including Grundy Center Elementary School and Grundy Center High School.
Ownership History
Date
Name
Owned For
Owner Type
Purchase Details
Closed on
Dec 2, 2018
Sold by
Haupt Todd
Bought by
Haupt Randy
Current Estimated Value
Home Financials for this Owner
Home Financials are based on the most recent Mortgage that was taken out on this home.
Original Mortgage
$83,333
Interest Rate
4.4%
Mortgage Type
New Conventional
Purchase Details
Closed on
Nov 9, 2011
Sold by
Symonds Angela Marie and Mabb Angela M
Bought by
Haupt Todd
Home Financials for this Owner
Home Financials are based on the most recent Mortgage that was taken out on this home.
Original Mortgage
$66,800
Interest Rate
4.02%
Mortgage Type
New Conventional
Create a Home Valuation Report for This Property
The Home Valuation Report is an in-depth analysis detailing your home's value as well as a comparison with similar homes in the area
Home Values in the Area
Average Home Value in this Area
Purchase History
| Date | Buyer | Sale Price | Title Company |
|---|---|---|---|
| Haupt Randy | $82,500 | -- | |
| Haupt Todd | $83,500 | -- |
Source: Public Records
Mortgage History
| Date | Status | Borrower | Loan Amount |
|---|---|---|---|
| Previous Owner | Haupt Randy | $83,333 | |
| Previous Owner | Haupt Todd | $66,800 |
Source: Public Records
Tax History Compared to Growth
Tax History
| Year | Tax Paid | Tax Assessment Tax Assessment Total Assessment is a certain percentage of the fair market value that is determined by local assessors to be the total taxable value of land and additions on the property. | Land | Improvement |
|---|---|---|---|---|
| 2025 | $2,040 | $120,590 | $14,280 | $106,310 |
| 2024 | $2,040 | $111,950 | $14,280 | $97,670 |
| 2023 | $2,068 | $111,950 | $14,280 | $97,670 |
| 2022 | $1,908 | $92,280 | $12,500 | $79,780 |
| 2021 | $1,908 | $92,280 | $12,500 | $79,780 |
| 2020 | $1,670 | $87,280 | $12,500 | $74,780 |
| 2019 | $1,474 | $87,280 | $12,500 | $74,780 |
| 2018 | $1,454 | $82,590 | $12,500 | $70,090 |
| 2017 | $1,400 | $82,590 | $12,500 | $70,090 |
| 2016 | $1,400 | $0 | $0 | $0 |
| 2015 | $1,400 | $0 | $0 | $0 |
| 2014 | $1,214 | $0 | $0 | $0 |
Source: Public Records
Map
Nearby Homes