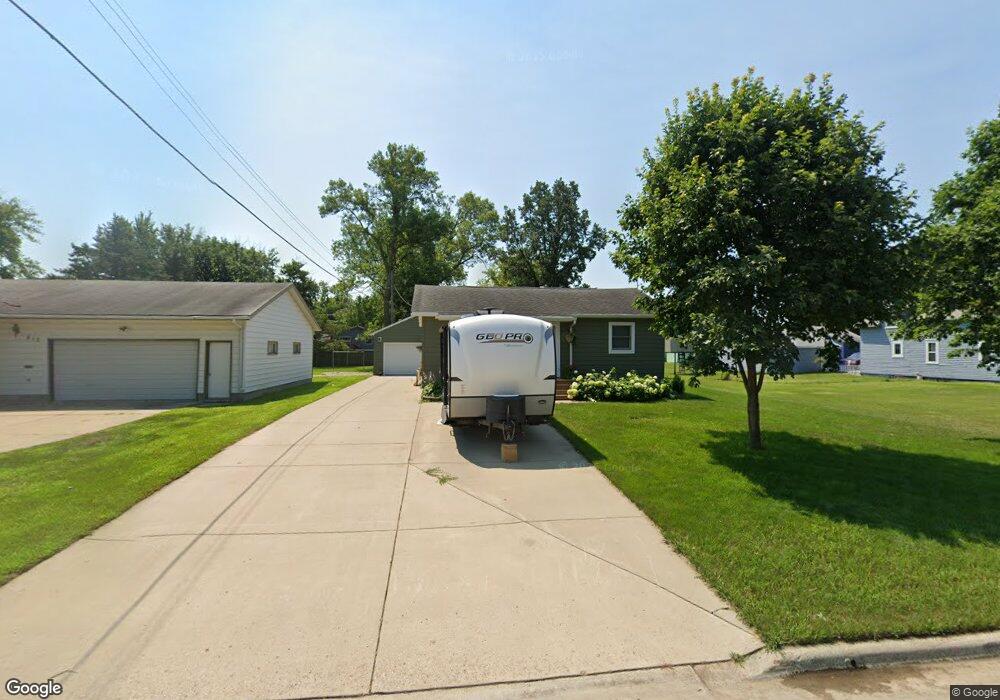
908 3rd St SE Pipestone, MN 56164
Estimated Value: $132,000 - $178,000
Studio
--
Bath
--
Sq Ft
5,793
Sq Ft Lot
About This Home
This home is located at 908 3rd St SE, Pipestone, MN 56164 and is currently estimated at $152,422. 908 3rd St SE is a home located in Pipestone County with nearby schools including Brown Elementary School, Pipestone Elementary School, and Pipestone Head Start.
Ownership History
Date
Name
Owned For
Owner Type
Purchase Details
Closed on
Jun 14, 2021
Sold by
Bloemendaal Luann M
Bought by
Nordmeyer Cole David
Current Estimated Value
Purchase Details
Closed on
Aug 18, 2017
Sold by
Julius Marilyn
Bought by
Nordmeyer Cole David
Home Financials for this Owner
Home Financials are based on the most recent Mortgage that was taken out on this home.
Original Mortgage
$82,828
Interest Rate
3.96%
Mortgage Type
New Conventional
Create a Home Valuation Report for This Property
The Home Valuation Report is an in-depth analysis detailing your home's value as well as a comparison with similar homes in the area
Home Values in the Area
Average Home Value in this Area
Purchase History
| Date | Buyer | Sale Price | Title Company |
|---|---|---|---|
| Nordmeyer Cole David | -- | Winter Title & Abstract Co | |
| Nordmeyer Cole David | $82,000 | Pipestone Abstract & Title |
Source: Public Records
Mortgage History
| Date | Status | Borrower | Loan Amount |
|---|---|---|---|
| Previous Owner | Nordmeyer Cole David | $82,828 |
Source: Public Records
Tax History
| Year | Tax Paid | Tax Assessment Tax Assessment Total Assessment is a certain percentage of the fair market value that is determined by local assessors to be the total taxable value of land and additions on the property. | Land | Improvement |
|---|---|---|---|---|
| 2025 | $1,348 | $134,900 | $9,600 | $125,300 |
| 2024 | $1,348 | $126,500 | $9,600 | $116,900 |
| 2023 | $1,174 | $119,400 | $9,600 | $109,800 |
| 2022 | $1,004 | $97,900 | $6,800 | $91,100 |
| 2021 | $916 | $82,800 | $4,600 | $78,200 |
| 2020 | $904 | $79,000 | $4,600 | $74,400 |
| 2019 | $832 | $77,900 | $3,600 | $74,300 |
| 2018 | $974 | $73,000 | $3,600 | $69,400 |
| 2017 | $1,000 | $83,300 | $3,600 | $79,700 |
| 2016 | $770 | $0 | $0 | $0 |
| 2015 | $858 | $43,500 | $2,400 | $41,100 |
| 2014 | $858 | $43,600 | $2,402 | $41,198 |
Source: Public Records
Map
Nearby Homes
- 201 10th Ave SE
- 702 4th St SE
- 321 5th Ave SE
- 109 5th Ave SE
- 607 4th Ave SE
- 801 6th Ave SE
- 804 6th Ave SE
- 807 7th Ave SE
- 102 3rd St SE
- 612 7th St NE Unit 6
- 804 9th St NE
- 219 3rd Ave SW
- 320 2nd St SW
- 320 2nd St NW
- 919 3rd Ave SW
- 831 4th Ave SW
- 910 3rd Ave SW
- 604 7th Ave SW
- 901 7th Ave SW
- 406 8th Ave SW
Your Personal Tour Guide
Ask me questions while you tour the home.