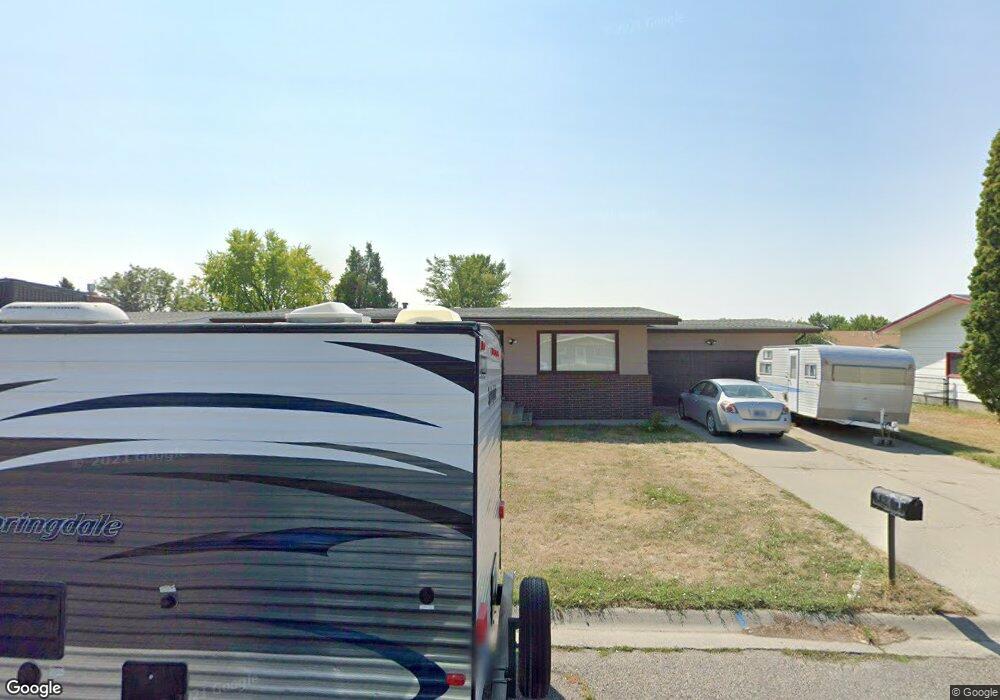
908 Anchor Ave Billings, MT 59105
Billings Heights NeighborhoodEstimated Value: $339,000 - $344,244
5
Beds
3
Baths
2,288
Sq Ft
$150/Sq Ft
Est. Value
About This Home
This home is located at 908 Anchor Ave, Billings, MT 59105 and is currently estimated at $342,811, approximately $149 per square foot. 908 Anchor Ave is a home located in Yellowstone County with nearby schools including Bitterroot School, Medicine Crow Middle School, and Skyview High School.
Ownership History
Date
Name
Owned For
Owner Type
Purchase Details
Closed on
Oct 21, 2024
Sold by
Daniel Bolick Ira Llc
Bought by
Brownell Kelsey and Brownell Gayle M
Current Estimated Value
Home Financials for this Owner
Home Financials are based on the most recent Mortgage that was taken out on this home.
Original Mortgage
$328,652
Outstanding Balance
$325,098
Interest Rate
6.2%
Mortgage Type
FHA
Estimated Equity
$17,713
Purchase Details
Closed on
Apr 11, 2024
Sold by
Henderson Jason J
Bought by
Daniel Bolick Ira Llc
Purchase Details
Closed on
Apr 15, 2008
Sold by
Big Man Lydina M
Bought by
Barrigan Gregg S and Pease Tara J
Home Financials for this Owner
Home Financials are based on the most recent Mortgage that was taken out on this home.
Original Mortgage
$157,784
Interest Rate
5.99%
Mortgage Type
FHA
Create a Home Valuation Report for This Property
The Home Valuation Report is an in-depth analysis detailing your home's value as well as a comparison with similar homes in the area
Home Values in the Area
Average Home Value in this Area
Purchase History
| Date | Buyer | Sale Price | Title Company |
|---|---|---|---|
| Brownell Kelsey | -- | First Montana Title | |
| Daniel Bolick Ira Llc | -- | None Listed On Document | |
| Barrigan Gregg S | -- | None Available |
Source: Public Records
Mortgage History
| Date | Status | Borrower | Loan Amount |
|---|---|---|---|
| Open | Brownell Kelsey | $328,652 | |
| Previous Owner | Barrigan Gregg S | $157,784 |
Source: Public Records
Tax History
| Year | Tax Paid | Tax Assessment Tax Assessment Total Assessment is a certain percentage of the fair market value that is determined by local assessors to be the total taxable value of land and additions on the property. | Land | Improvement |
|---|---|---|---|---|
| 2025 | $2,794 | $331,200 | $62,964 | $268,236 |
| 2024 | $2,794 | $283,100 | $59,307 | $223,793 |
| 2023 | $3,241 | $283,100 | $59,307 | $223,793 |
| 2022 | $1,846 | $195,500 | $0 | $0 |
| 2021 | $2,137 | $195,500 | $0 | $0 |
| 2020 | $2,256 | $198,200 | $0 | $0 |
| 2019 | $2,155 | $198,200 | $0 | $0 |
| 2018 | $2,048 | $184,200 | $0 | $0 |
| 2017 | $1,989 | $184,200 | $0 | $0 |
| 2016 | $1,836 | $171,500 | $0 | $0 |
| 2015 | $1,795 | $171,500 | $0 | $0 |
| 2014 | $1,650 | $83,369 | $0 | $0 |
Source: Public Records
Map
Nearby Homes
- 1417 Naples St
- 1329 Cottonwood Blvd
- 1525 Bench Blvd Unit 29
- 1224 Cherry Island Dr
- 1214 Cottonwood Blvd
- TBD U S 87
- 1518 S Ping Cir
- 1147 Eldora Ln
- 933 Bench Blvd
- 1327 Tania Cir
- 1621 Kelby Dr
- 737 Lambrecht Ln
- 1627 Kelby Dr
- 1612 Kelby Dr
- 1635 Kelby Dr
- 1643 Kelby Dr
- 1628 Kelby Dr
- 1636 Kelby Dr
- 424 Wicks Ln
- 423 Kuhlman Dr
Your Personal Tour Guide
Ask me questions while you tour the home.