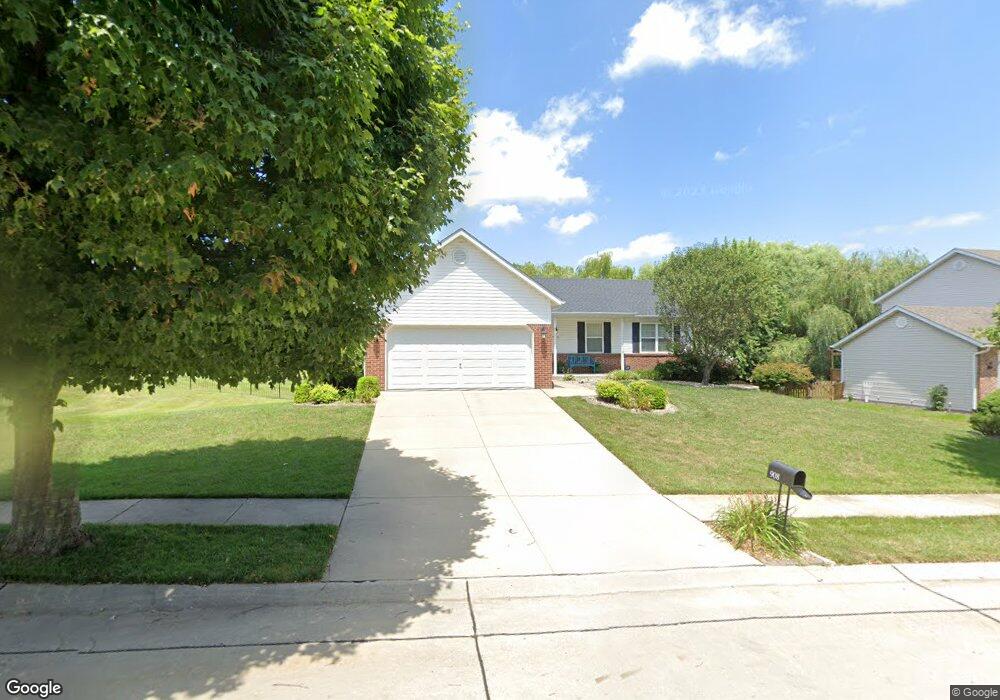
908 Jordan O Fallon, IL 62269
Estimated Value: $334,000 - $422,000
Studio
--
Bath
1,500
Sq Ft
$249/Sq Ft
Est. Value
About This Home
This home is located at 908 Jordan, O Fallon, IL 62269 and is currently estimated at $373,679, approximately $249 per square foot. 908 Jordan is a home located in St. Clair County with nearby schools including Moye Elementary School, Carriel Junior High School, and O'Fallon Township High School.
Ownership History
Date
Name
Owned For
Owner Type
Purchase Details
Closed on
Jul 8, 2024
Sold by
Stoffel Patrick B and Stoffel Martha F
Bought by
Stoffel Patrick B and Martha F Stoffel Revocable Trust
Current Estimated Value
Purchase Details
Closed on
Jul 28, 2006
Sold by
Pleskovitch Michael J and Pleskovitch Roxanne E
Bought by
Stoffel Patrick B and Stoffel Martha
Home Financials for this Owner
Home Financials are based on the most recent Mortgage that was taken out on this home.
Original Mortgage
$32,985
Interest Rate
6.85%
Mortgage Type
Unknown
Purchase Details
Closed on
Jul 17, 2003
Sold by
Ross Stacey
Bought by
Huff Linda and D&D Construction
Home Financials for this Owner
Home Financials are based on the most recent Mortgage that was taken out on this home.
Original Mortgage
$170,340
Interest Rate
5.3%
Mortgage Type
VA
Purchase Details
Closed on
Jul 16, 2003
Sold by
Huff Linda
Bought by
Pleskovitch Michael J and Pleskovitch Roxanne E
Home Financials for this Owner
Home Financials are based on the most recent Mortgage that was taken out on this home.
Original Mortgage
$170,340
Interest Rate
5.3%
Mortgage Type
VA
Create a Home Valuation Report for This Property
The Home Valuation Report is an in-depth analysis detailing your home's value as well as a comparison with similar homes in the area
Home Values in the Area
Average Home Value in this Area
Purchase History
| Date | Buyer | Sale Price | Title Company |
|---|---|---|---|
| Stoffel Patrick B | -- | None Available | |
| Stoffel Patrick B | $220,000 | First American Title Insuran | |
| Huff Linda | -- | First American Title Insuran | |
| Pleskovitch Michael J | $167,000 | First American Title Insuran |
Source: Public Records
Mortgage History
| Date | Status | Borrower | Loan Amount |
|---|---|---|---|
| Previous Owner | Stoffel Patrick B | $32,985 | |
| Previous Owner | Stoffel Patrick B | $175,920 | |
| Previous Owner | Pleskovitch Michael J | $170,340 |
Source: Public Records
Tax History
| Year | Tax Paid | Tax Assessment Tax Assessment Total Assessment is a certain percentage of the fair market value that is determined by local assessors to be the total taxable value of land and additions on the property. | Land | Improvement |
|---|---|---|---|---|
| 2024 | $5,796 | $85,511 | $18,336 | $67,175 |
| 2023 | $5,296 | $75,895 | $16,274 | $59,621 |
| 2022 | $4,971 | $69,776 | $14,962 | $54,814 |
| 2021 | $4,941 | $68,231 | $15,010 | $53,221 |
| 2020 | $4,897 | $64,587 | $14,209 | $50,378 |
| 2019 | $4,775 | $64,587 | $14,209 | $50,378 |
| 2018 | $4,639 | $62,711 | $13,796 | $48,915 |
| 2017 | $4,224 | $55,740 | $16,026 | $39,714 |
| 2016 | $4,208 | $54,439 | $15,652 | $38,787 |
| 2014 | $3,881 | $53,809 | $15,471 | $38,338 |
| 2013 | $4,643 | $51,483 | $15,241 | $36,242 |
Source: Public Records
Map
Nearby Homes
- 809 E Deer Creek Rd
- 1676 Lancaster Dr
- 166 Berringer Dr
- 168 Knollhaven Trail
- 518 Deer Creek Rd
- 160 Stonehaven Ct
- 1104 N Smiley St
- 1001 Ramblewood Dr
- 1845 Riviera Ln
- 622 Saint Nicholas Dr
- 109 Sherryl Ct
- 149 Bethel Rd
- 1338 Piasa Ct
- 504 Overbrook Cir
- 1251 Wayne Ct
- 11274 Branding Stone Dr
- 1229 Elisabeth Dr
- 1042 Oriole Dr
- 621 E Wesley Dr
- 115 Cobblestone Hill
Your Personal Tour Guide
Ask me questions while you tour the home.