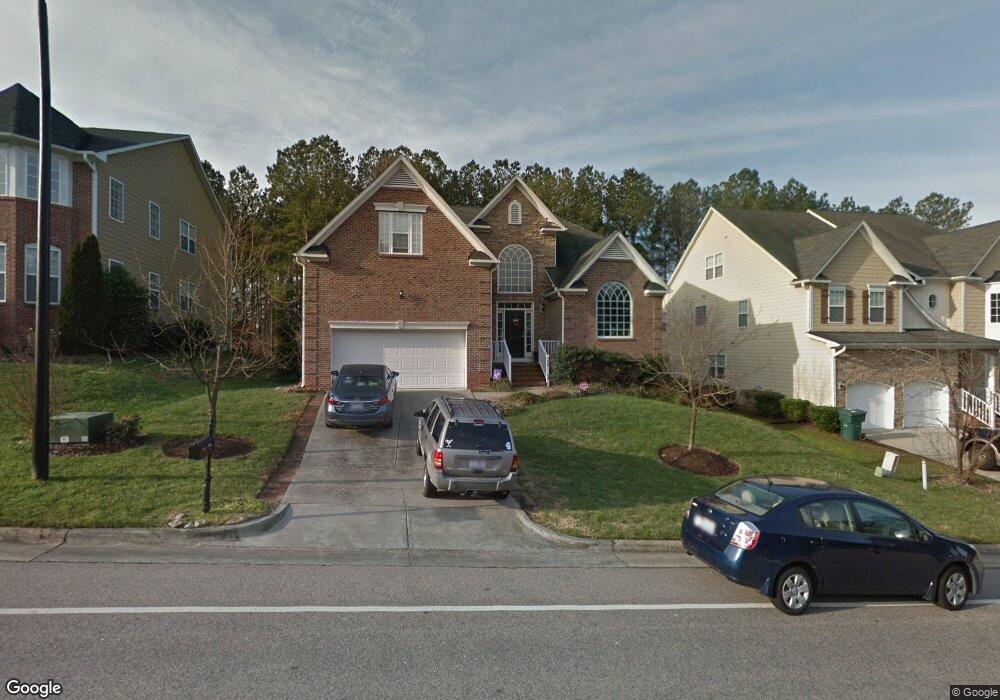
908 Oak Grove Pkwy Durham, NC 27703
Eastern Durham NeighborhoodEstimated Value: $544,000 - $608,000
4
Beds
4
Baths
3,476
Sq Ft
$166/Sq Ft
Est. Value
About This Home
This home is located at 908 Oak Grove Pkwy, Durham, NC 27703 and is currently estimated at $577,724, approximately $166 per square foot. 908 Oak Grove Pkwy is a home located in Durham County with nearby schools including Oak Grove Elementary, John W Neal Middle School, and Southern School of Energy & Sustainability.
Ownership History
Date
Name
Owned For
Owner Type
Purchase Details
Closed on
Jul 14, 2020
Sold by
Clewell Harvey Joseph and Clewell Lee Ann
Bought by
Clay Bryan Michael and Clay Chaundra
Current Estimated Value
Home Financials for this Owner
Home Financials are based on the most recent Mortgage that was taken out on this home.
Original Mortgage
$361,334
Outstanding Balance
$320,407
Interest Rate
3.1%
Mortgage Type
FHA
Estimated Equity
$257,317
Purchase Details
Closed on
May 27, 2005
Sold by
D R Horton Inc Torrey
Bought by
Clewell Harvey Joseph and Clewell Lee Ann L
Home Financials for this Owner
Home Financials are based on the most recent Mortgage that was taken out on this home.
Original Mortgage
$35,051
Interest Rate
5.74%
Mortgage Type
Purchase Money Mortgage
Create a Home Valuation Report for This Property
The Home Valuation Report is an in-depth analysis detailing your home's value as well as a comparison with similar homes in the area
Home Values in the Area
Average Home Value in this Area
Purchase History
| Date | Buyer | Sale Price | Title Company |
|---|---|---|---|
| Clay Bryan Michael | $375,000 | First American Mortgage Sln | |
| Clewell Harvey Joseph | $275,500 | Bb&T |
Source: Public Records
Mortgage History
| Date | Status | Borrower | Loan Amount |
|---|---|---|---|
| Open | Clay Bryan Michael | $361,334 | |
| Previous Owner | Clewell Harvey Joseph | $35,051 | |
| Previous Owner | Clewell Harvey Joseph | $220,204 |
Source: Public Records
Tax History Compared to Growth
Tax History
| Year | Tax Paid | Tax Assessment Tax Assessment Total Assessment is a certain percentage of the fair market value that is determined by local assessors to be the total taxable value of land and additions on the property. | Land | Improvement |
|---|---|---|---|---|
| 2025 | $5,572 | $562,059 | $96,750 | $465,309 |
| 2024 | $4,796 | $343,845 | $48,450 | $295,395 |
| 2023 | $4,504 | $343,845 | $48,450 | $295,395 |
| 2022 | $4,401 | $343,845 | $48,450 | $295,395 |
| 2021 | $4,380 | $343,845 | $48,450 | $295,395 |
| 2020 | $4,277 | $343,845 | $48,450 | $295,395 |
| 2019 | $4,277 | $343,845 | $48,450 | $295,395 |
| 2018 | $4,176 | $307,819 | $45,185 | $262,634 |
| 2017 | $4,145 | $307,819 | $45,185 | $262,634 |
| 2016 | $4,005 | $307,819 | $45,185 | $262,634 |
| 2015 | $4,449 | $321,385 | $57,242 | $264,143 |
| 2014 | $4,449 | $321,385 | $57,242 | $264,143 |
Source: Public Records
Map
Nearby Homes
- 1 Thorn Brook Ct
- 103 Bermuda Green Dr
- 106 Newberry Ln
- 110 Kindlewood Dr
- 406 Robbins Rd
- 402 Robbins Rd
- 208 Lick Creek Ln
- 10 Autrey Mill Cir
- 2800-2809 Napoli Dr
- 4 Fire Rock Place
- 2117 Fletchers Ridge Dr
- 1 Kings Grant Ct
- 301 Sylvias Ct
- 210 Stallings Rd
- 5409 Hadrian Dr
- 5609 Thistlerock Ln
- 416 Chivalry Dr
- 4 N Berrymeadow Ln
- 31 S Angela Cir
- 507 Chivalry Dr
- 910 Oak Grove Pkwy
- 906 Oak Grove Pkwy
- 904 Oak Grove Pkwy
- 912 Oak Grove Pkwy
- 8 Piedmont Forest Ct
- 6 Piedmont Forest Ct
- 902 Oak Grove Pkwy
- 909 Oak Grove Pkwy
- 911 Oak Grove Pkwy
- 907 Oak Grove Pkwy
- 4 Piedmont Forest Ct
- 10 Piedmont Forest Ct
- 913 Oak Grove Pkwy
- 905 Oak Grove Pkwy
- 2 Piedmont Forest Ct
- 12 Piedmont Forest Ct
- 3 Thorn Brook Ct
- 7 Piedmont Forest Ct
- 5 Piedmont Forest Ct
- 5 Piedmont Forest Ct